Bitcoin Struggling
cryptocurrency·@workin2005·
0.000 HBDBitcoin Struggling
 Bitcoin's been struggling to pick a path. The bulls and bears seem to be in a stalemate. The 2 possible scenarios I've laid out over the past week are still in play. Depending on which scenario we're in, Bitcoin may have completed wave 1 or wave A. Let's look at the bullish scenario first.  Assuming we're in 5 waves up, it looks like wave 1 is complete with wave 2 looking for bottom. Wave 2 bounced almost perfectly off the 0.382 fib level, only briefly penetrating with just a wick. This may have been the pivot point, but only time will tell. If bitcoin does drop below the 0.382, there's strong support at the 0.618 fib level ($8,185). 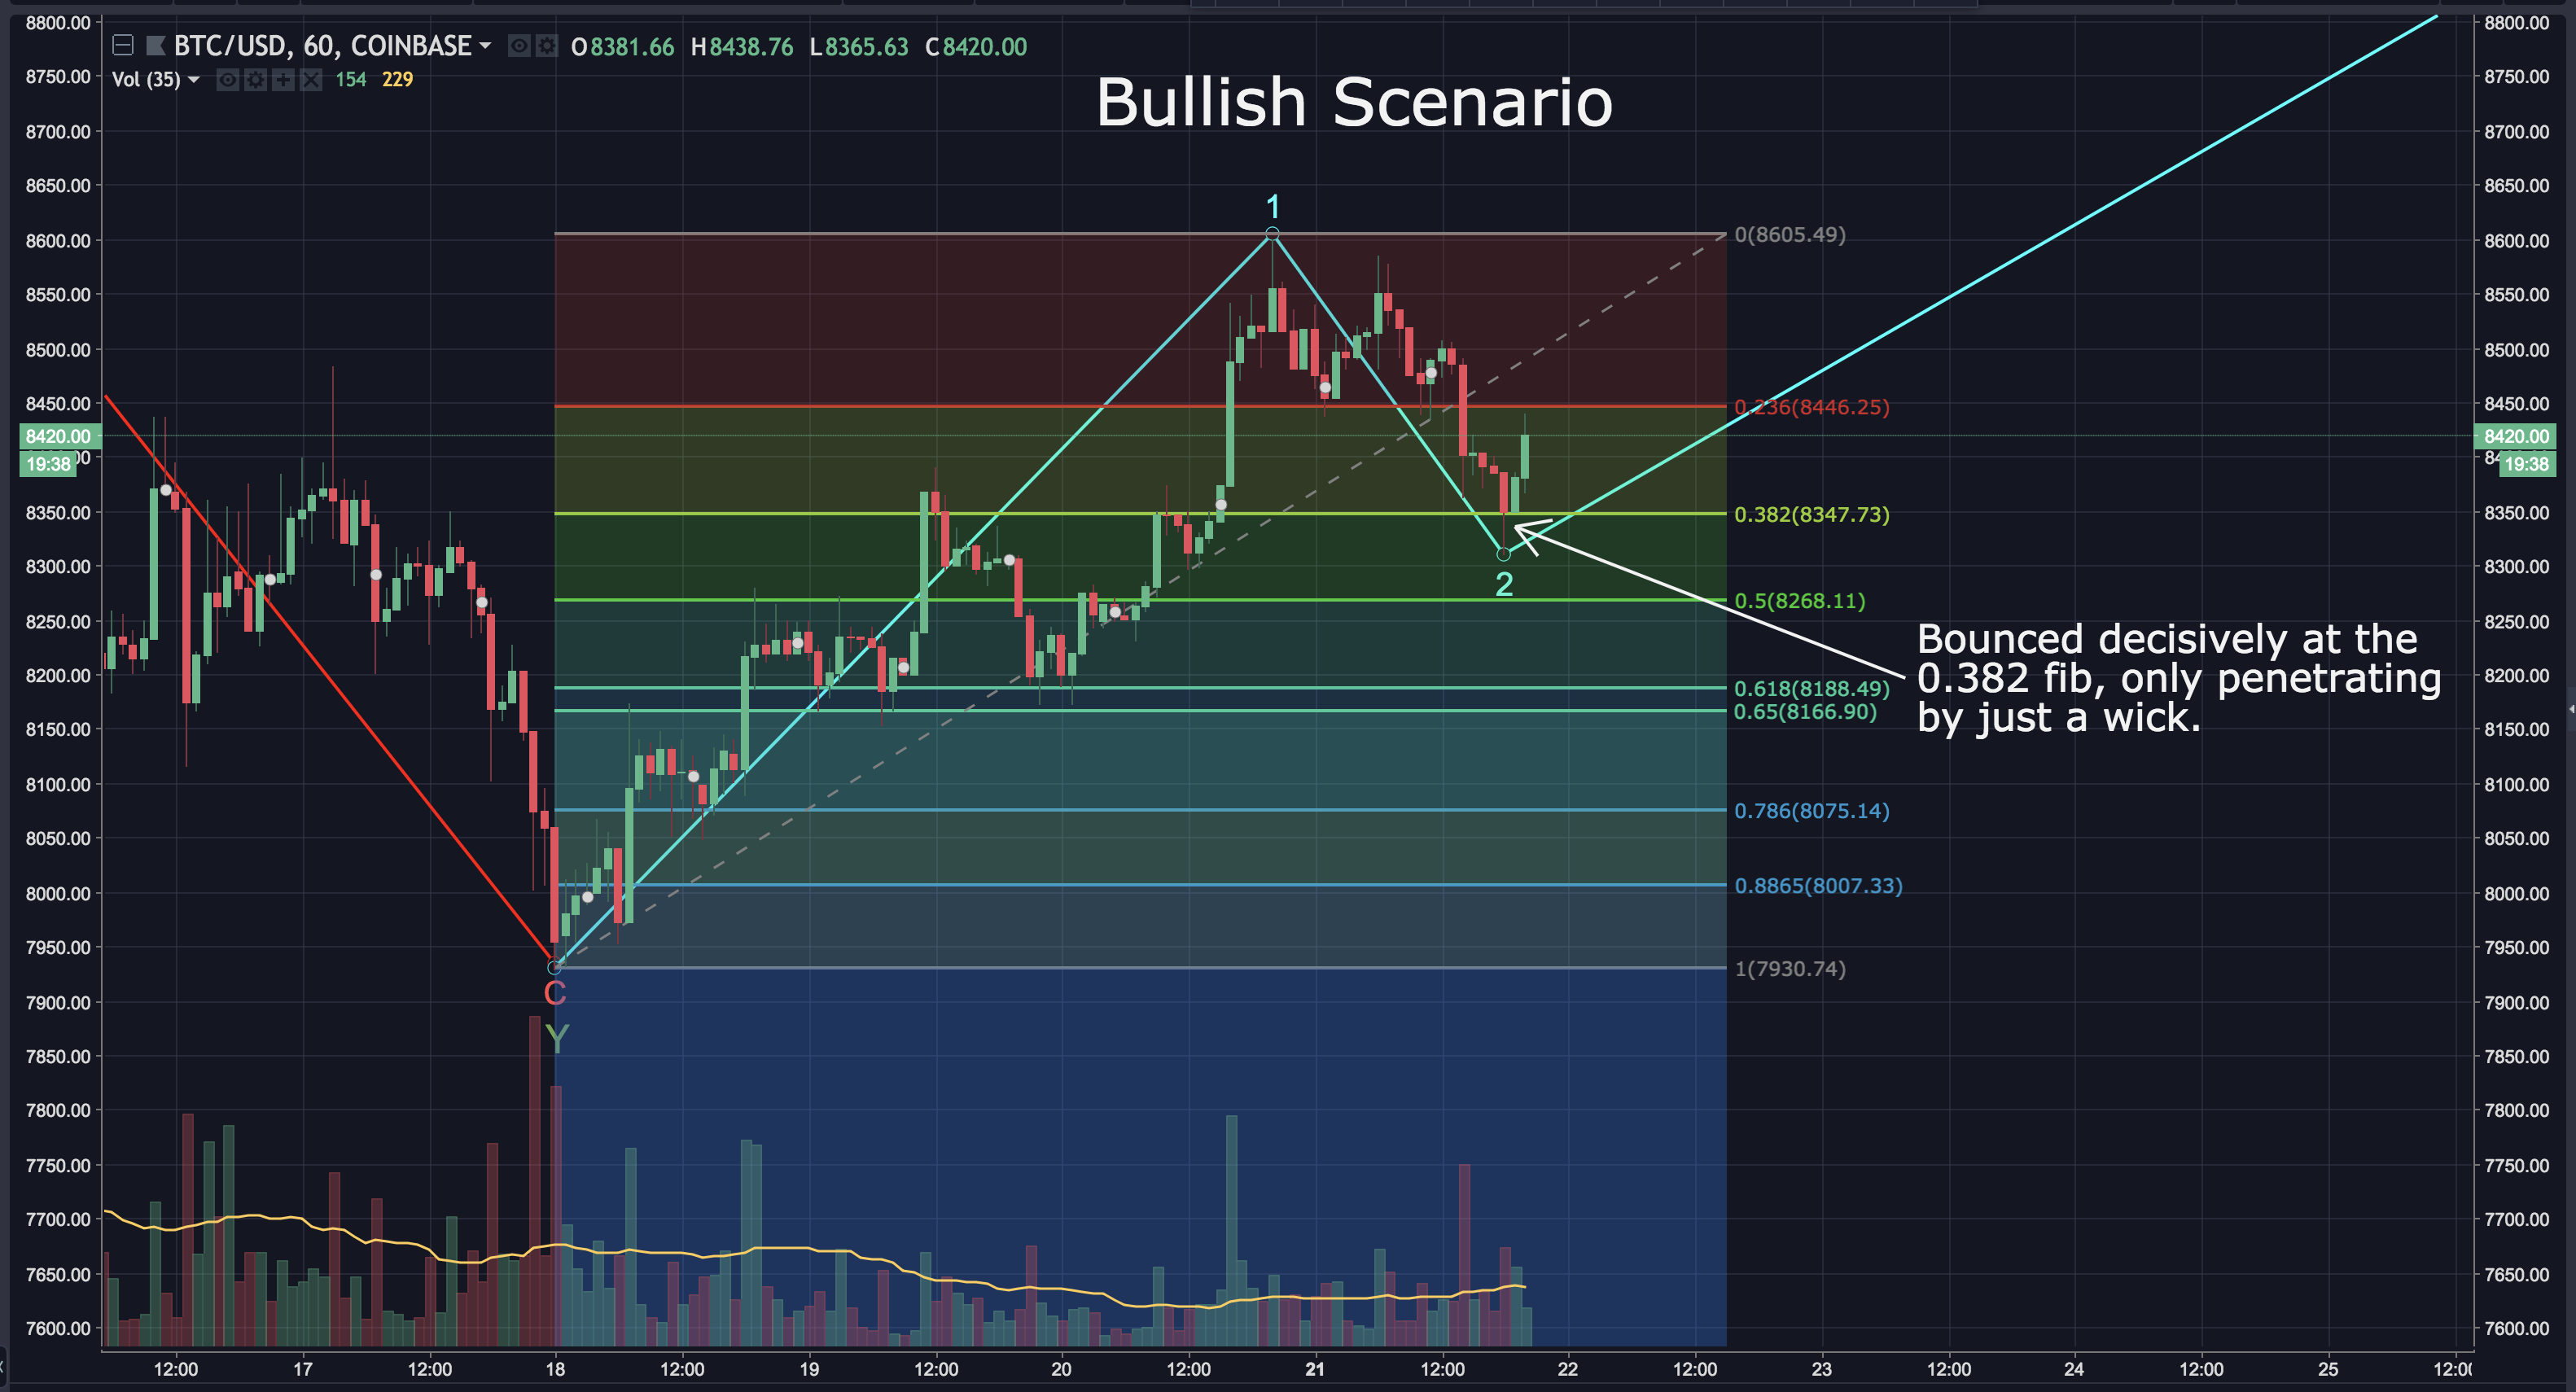 Zooming out, a logical target for wave 3 (given the weak volume) is the 1.0 fib level. This would be $9.002. If bitcoin drops below the 0.382 fib, it'll most likely drop to the 0.618 fib level ($8,185). 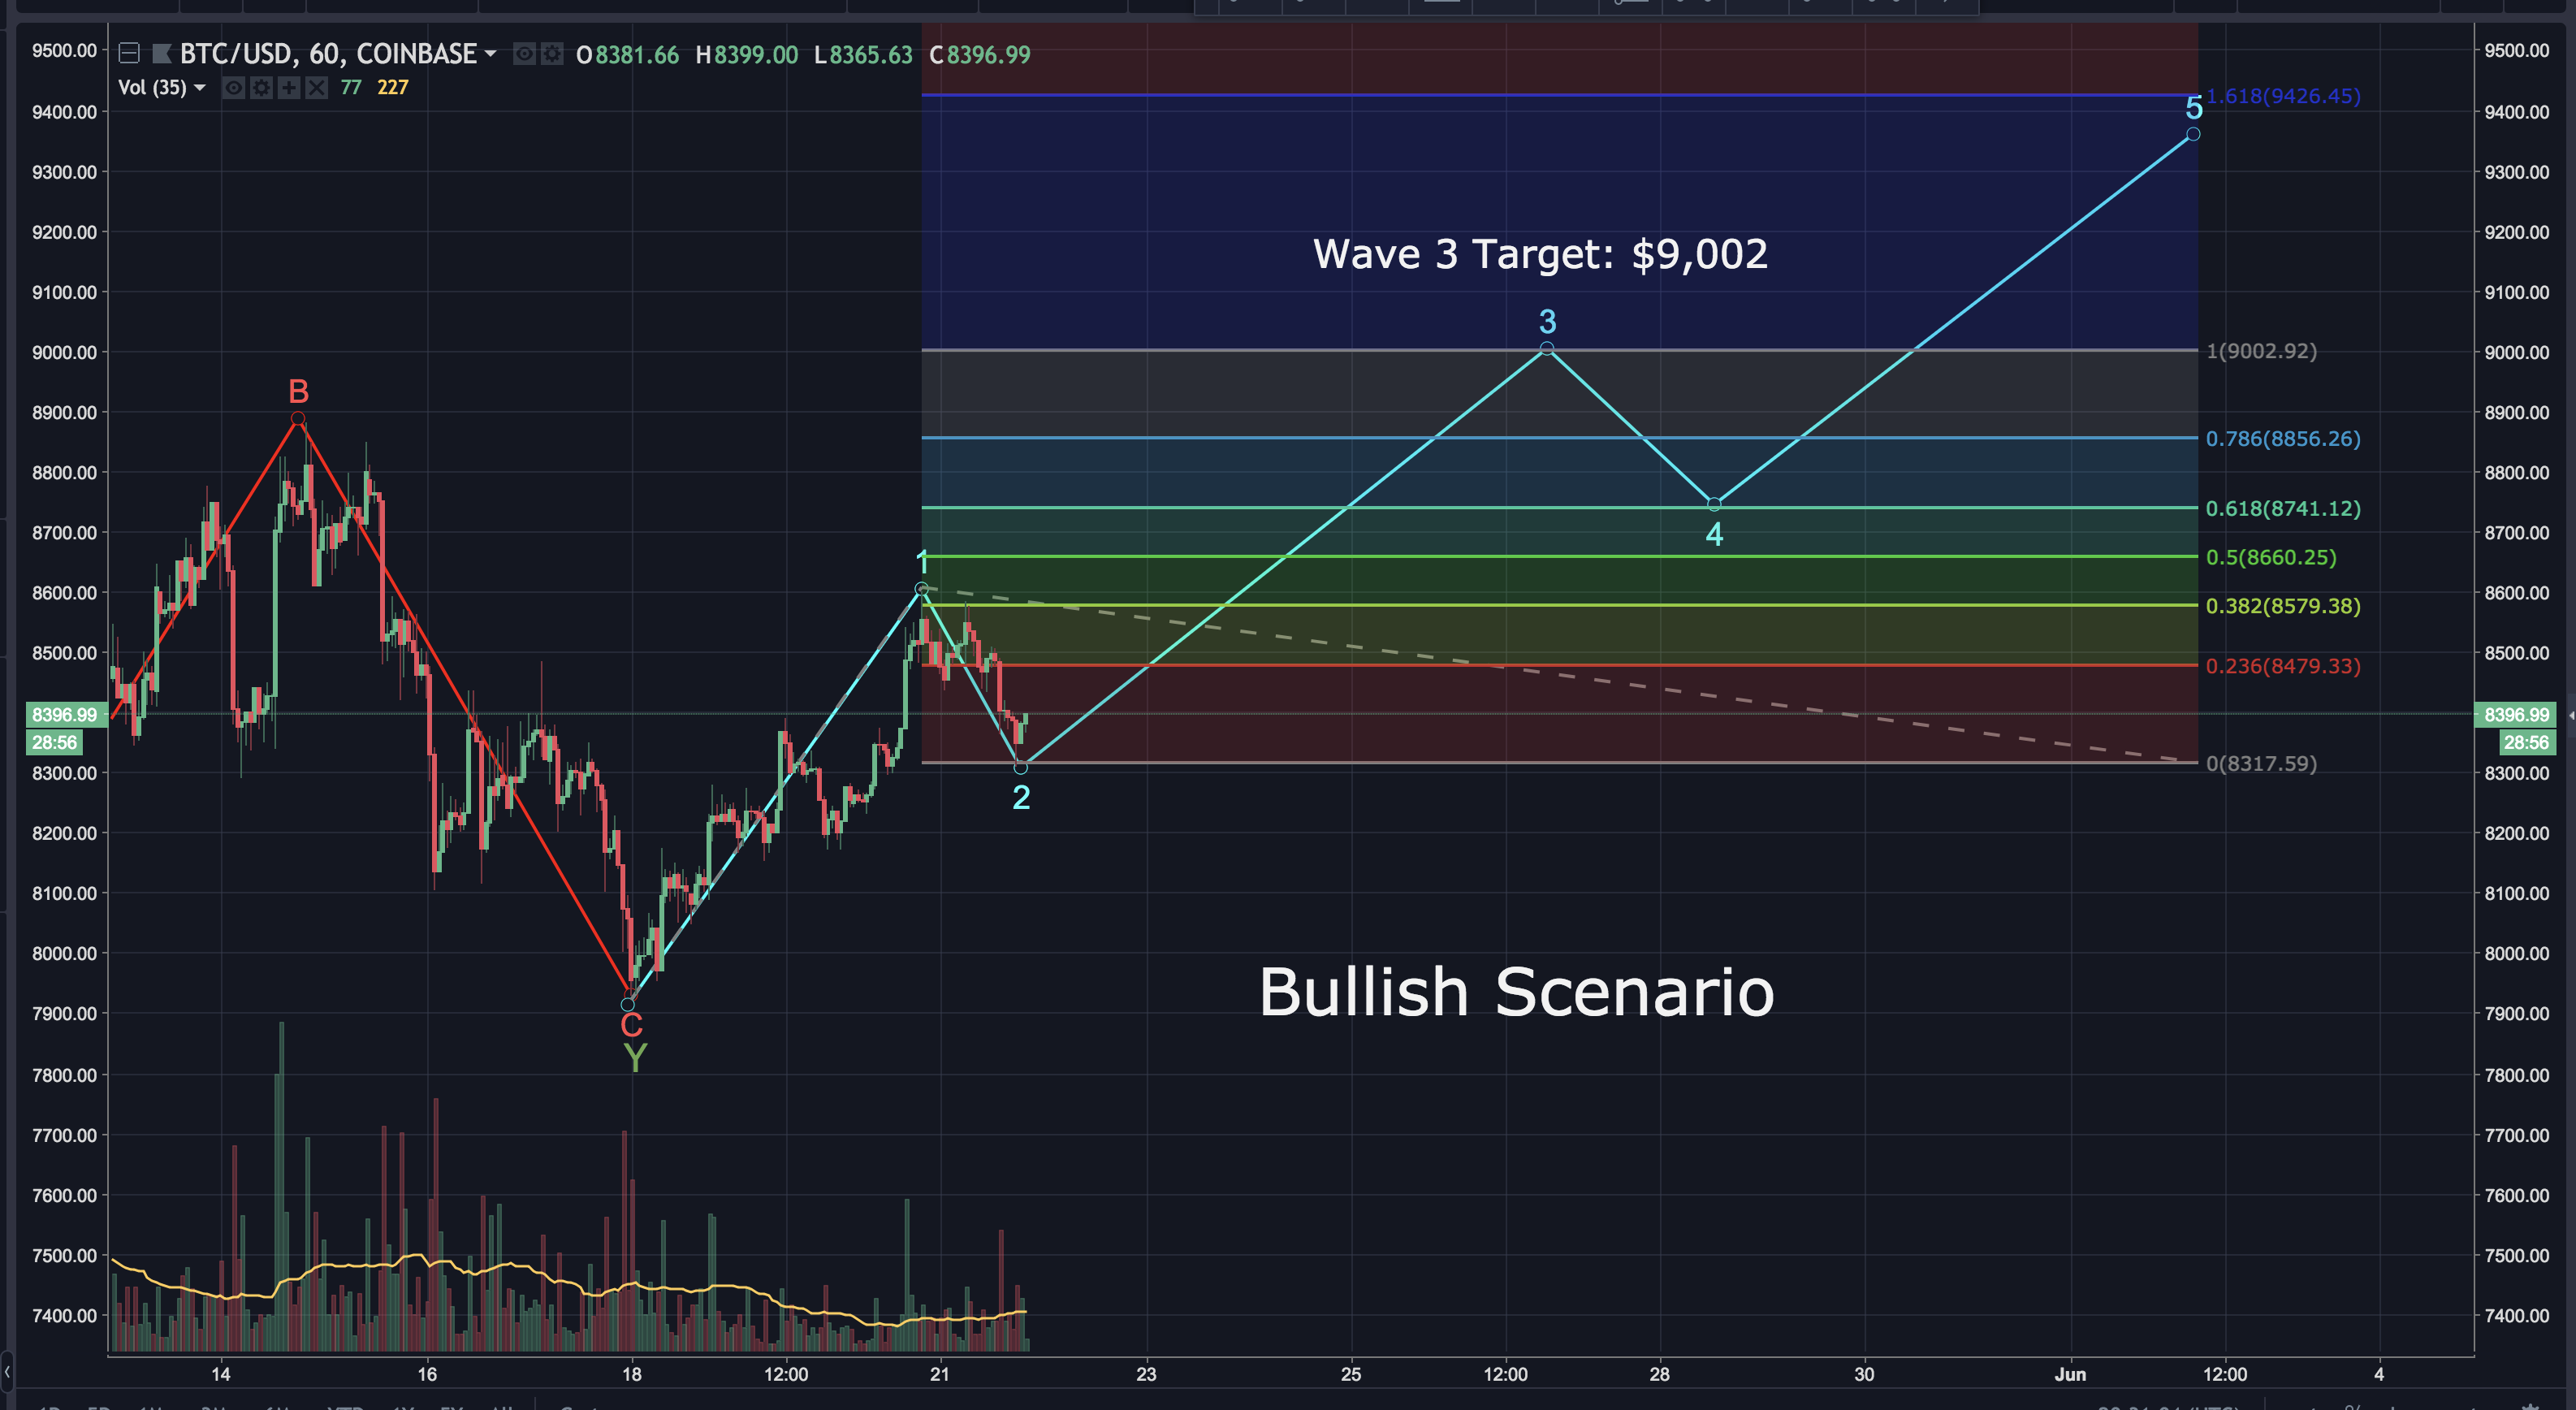 **Now let's look at the bearish scenario...**  The bearish scenario has wave A complete, with wave B looking for bottom. If this is correct, I'd expect wave B to drop at least as low as $8,200. It may play out like this: 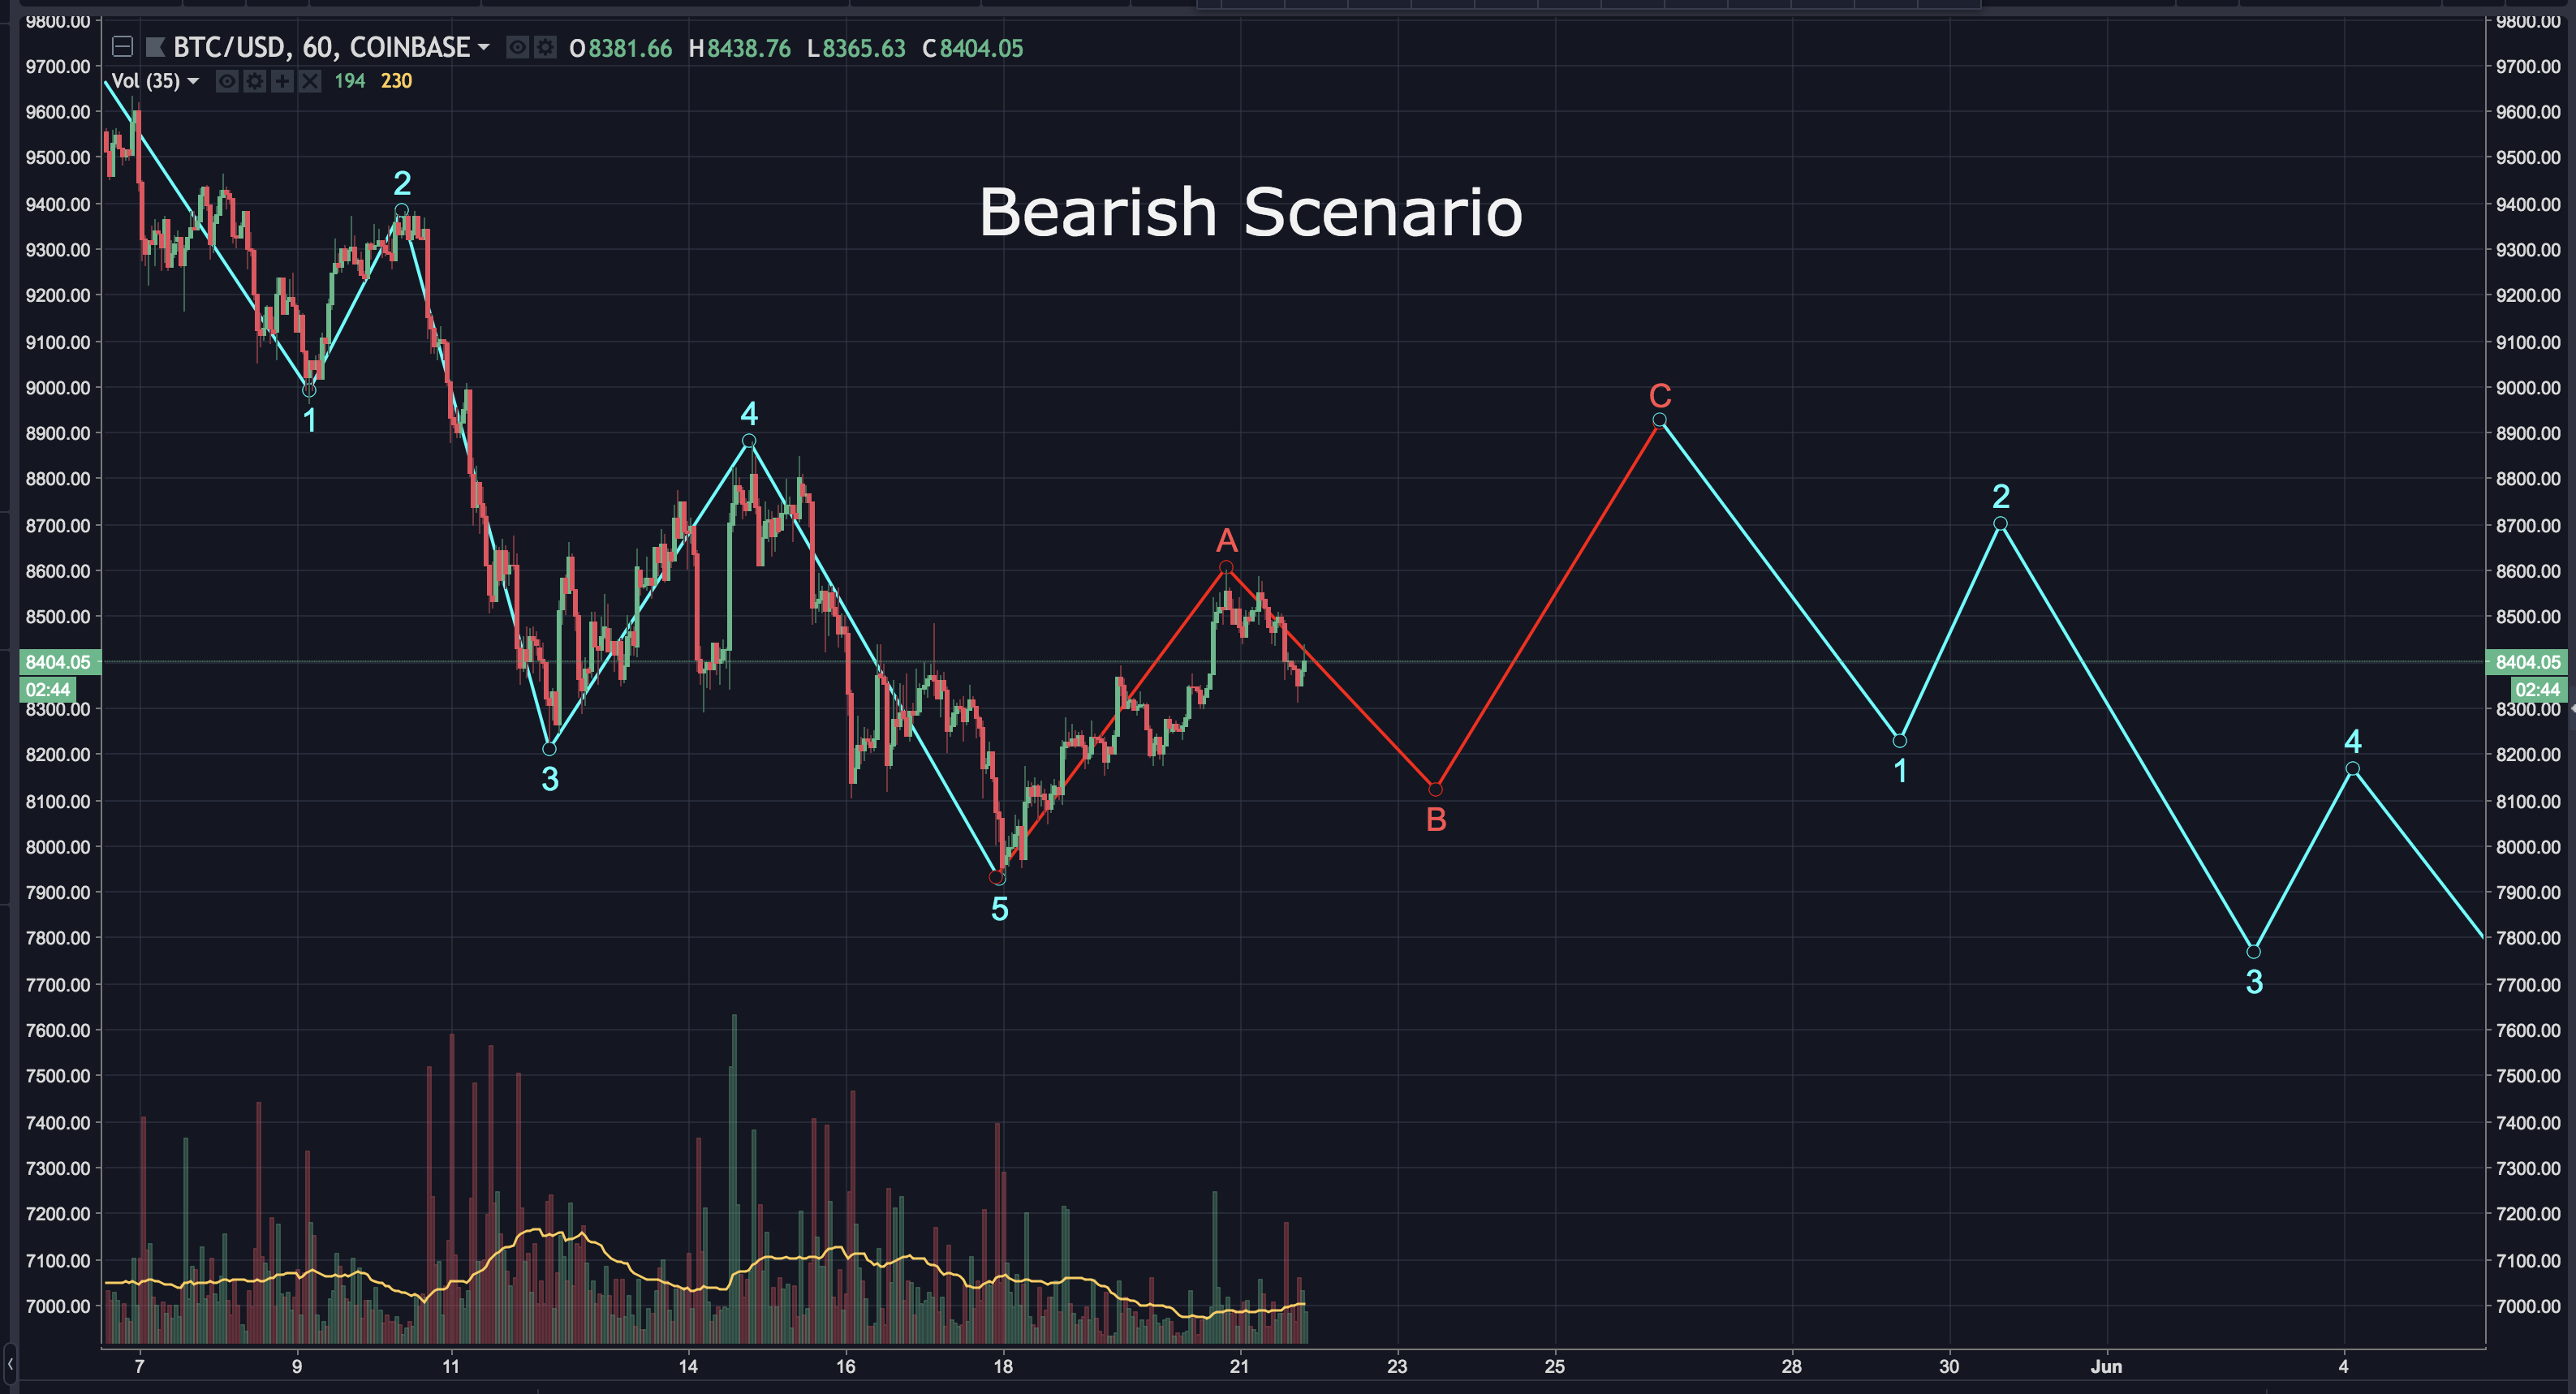 Looking at the 1 hour chart, we can see bearish divergence on both the RSI and MACD. 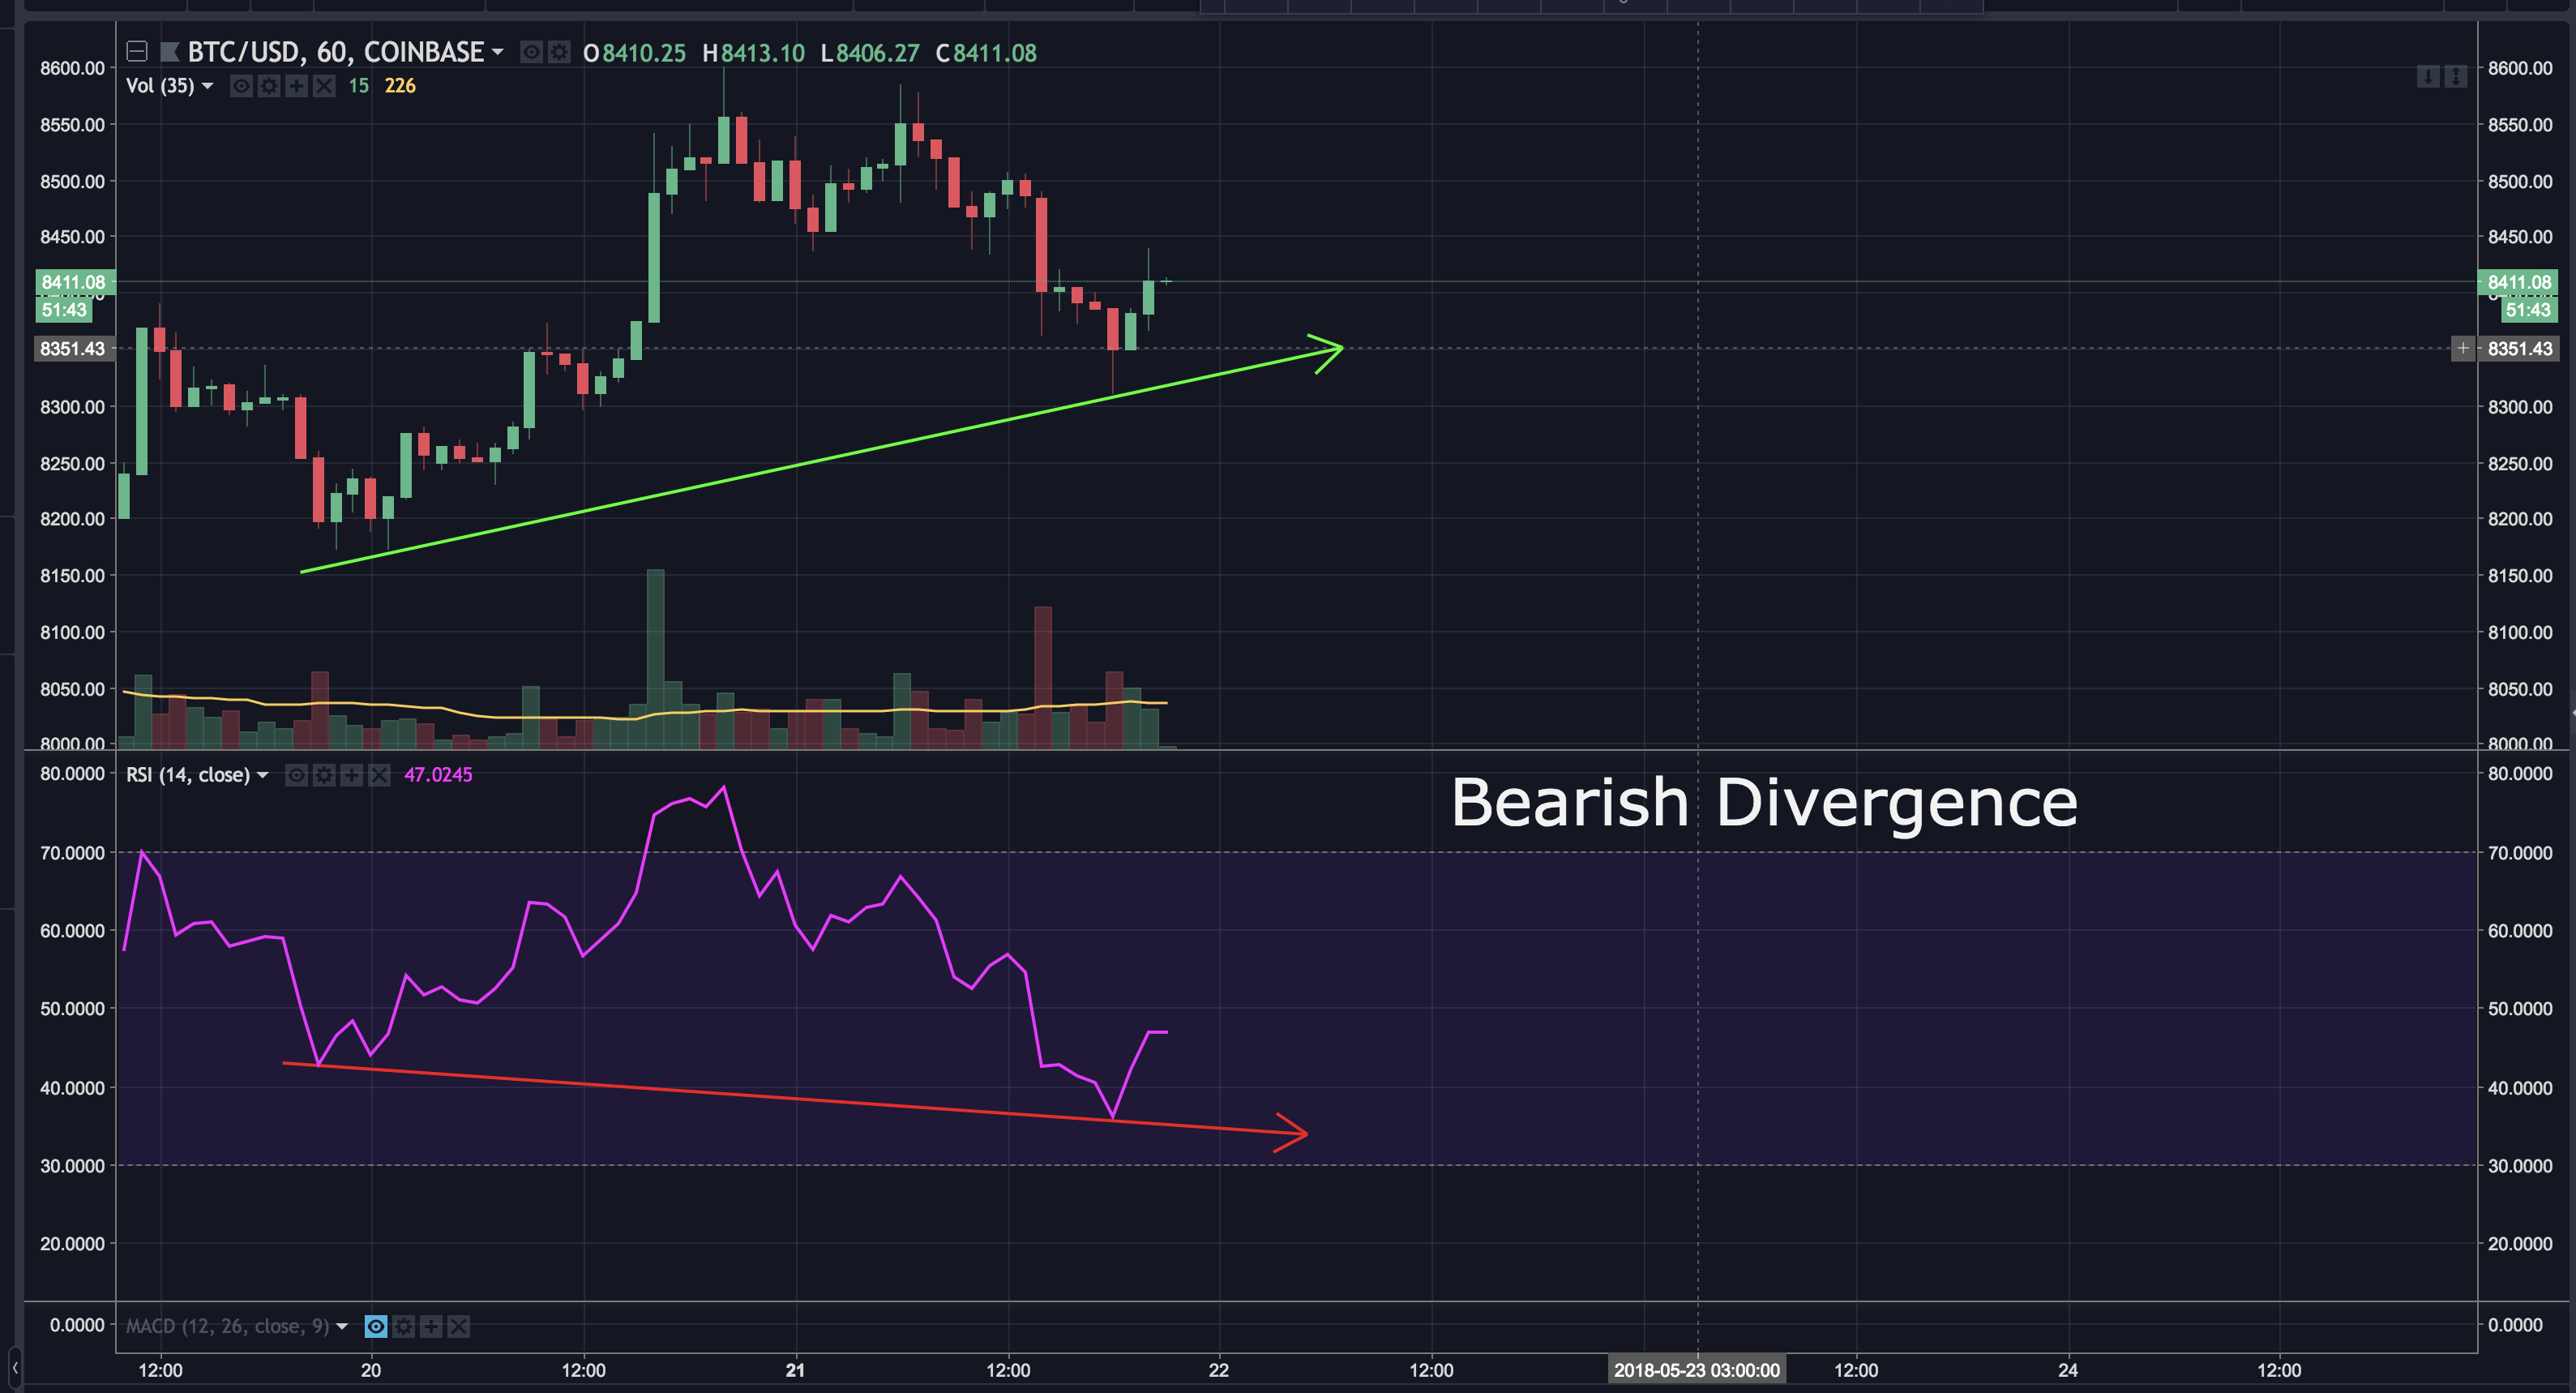 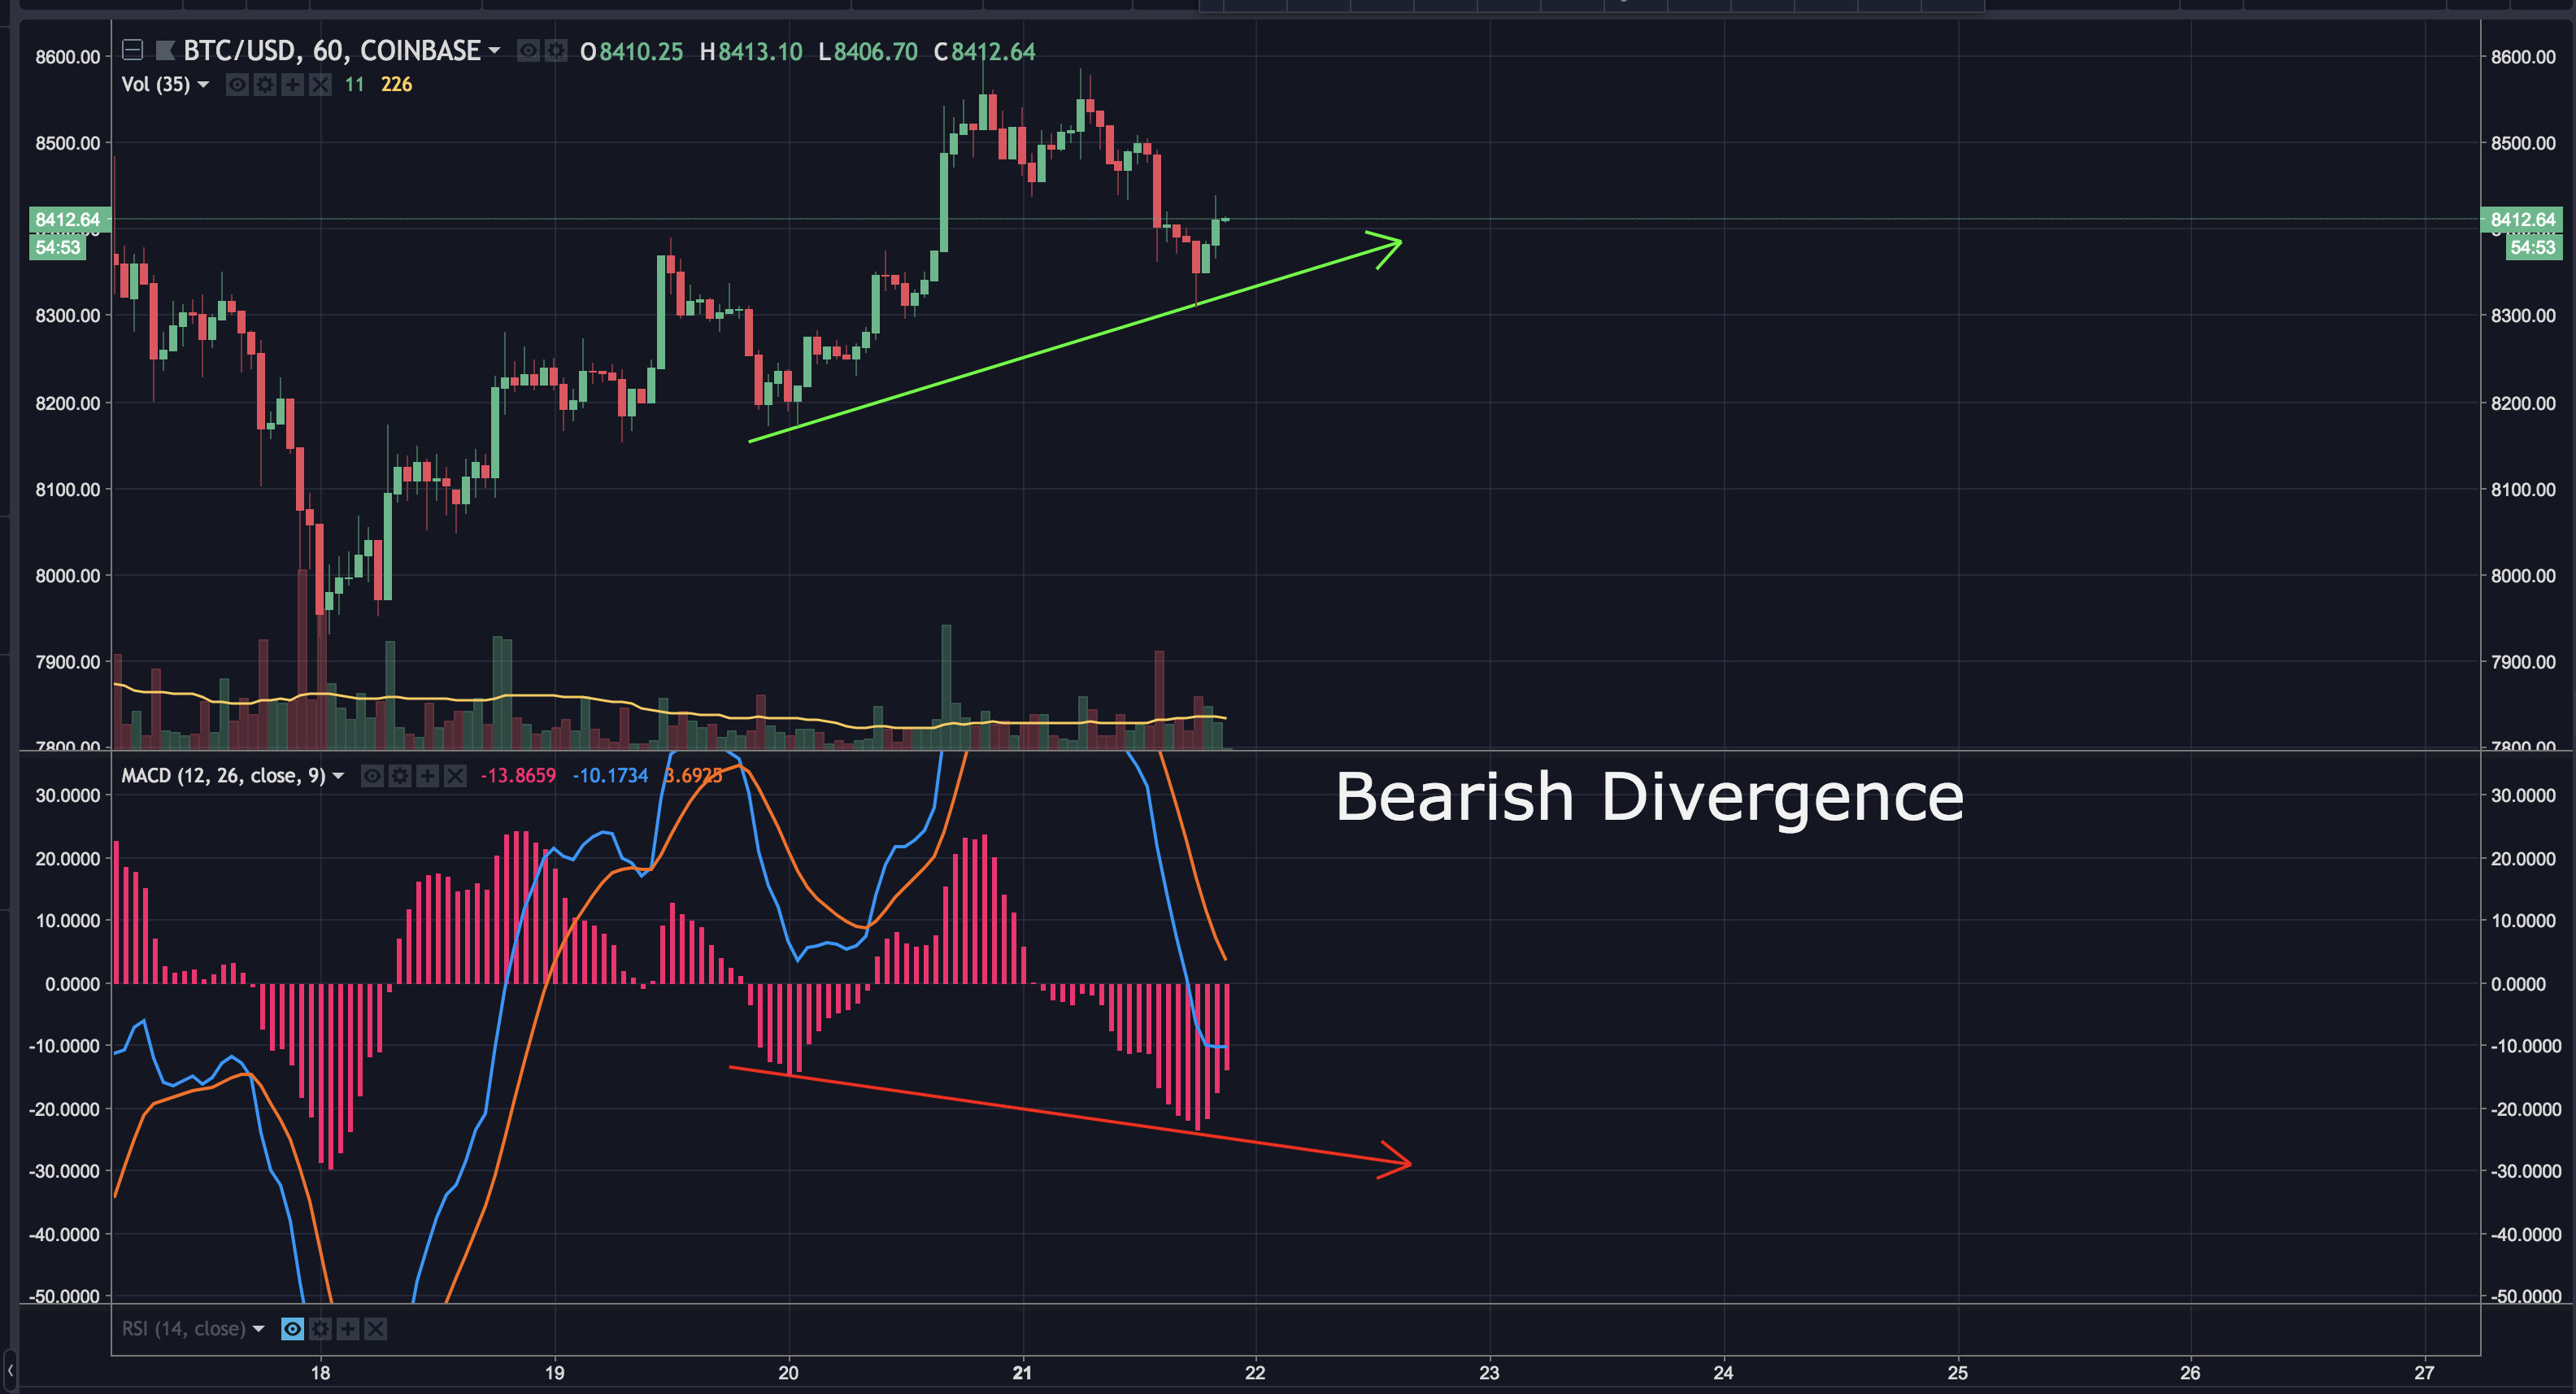 This suggests another drop may be coming ...at least short term. If the volume remains low, I believe a drop is likely. There's strong support at $8,270 (0.5 fib) and again at $8,185 (0.618 fib). If it drops below that level, I'll have to re-evaluate my analysis. Looking at the bigger picture, I want to remind you of a descending triangle I pointed out last week. This is a perfect example of mixed signals buried within the market today. A descending triangle suggests a major move is coming, however, the move could be up OR down. 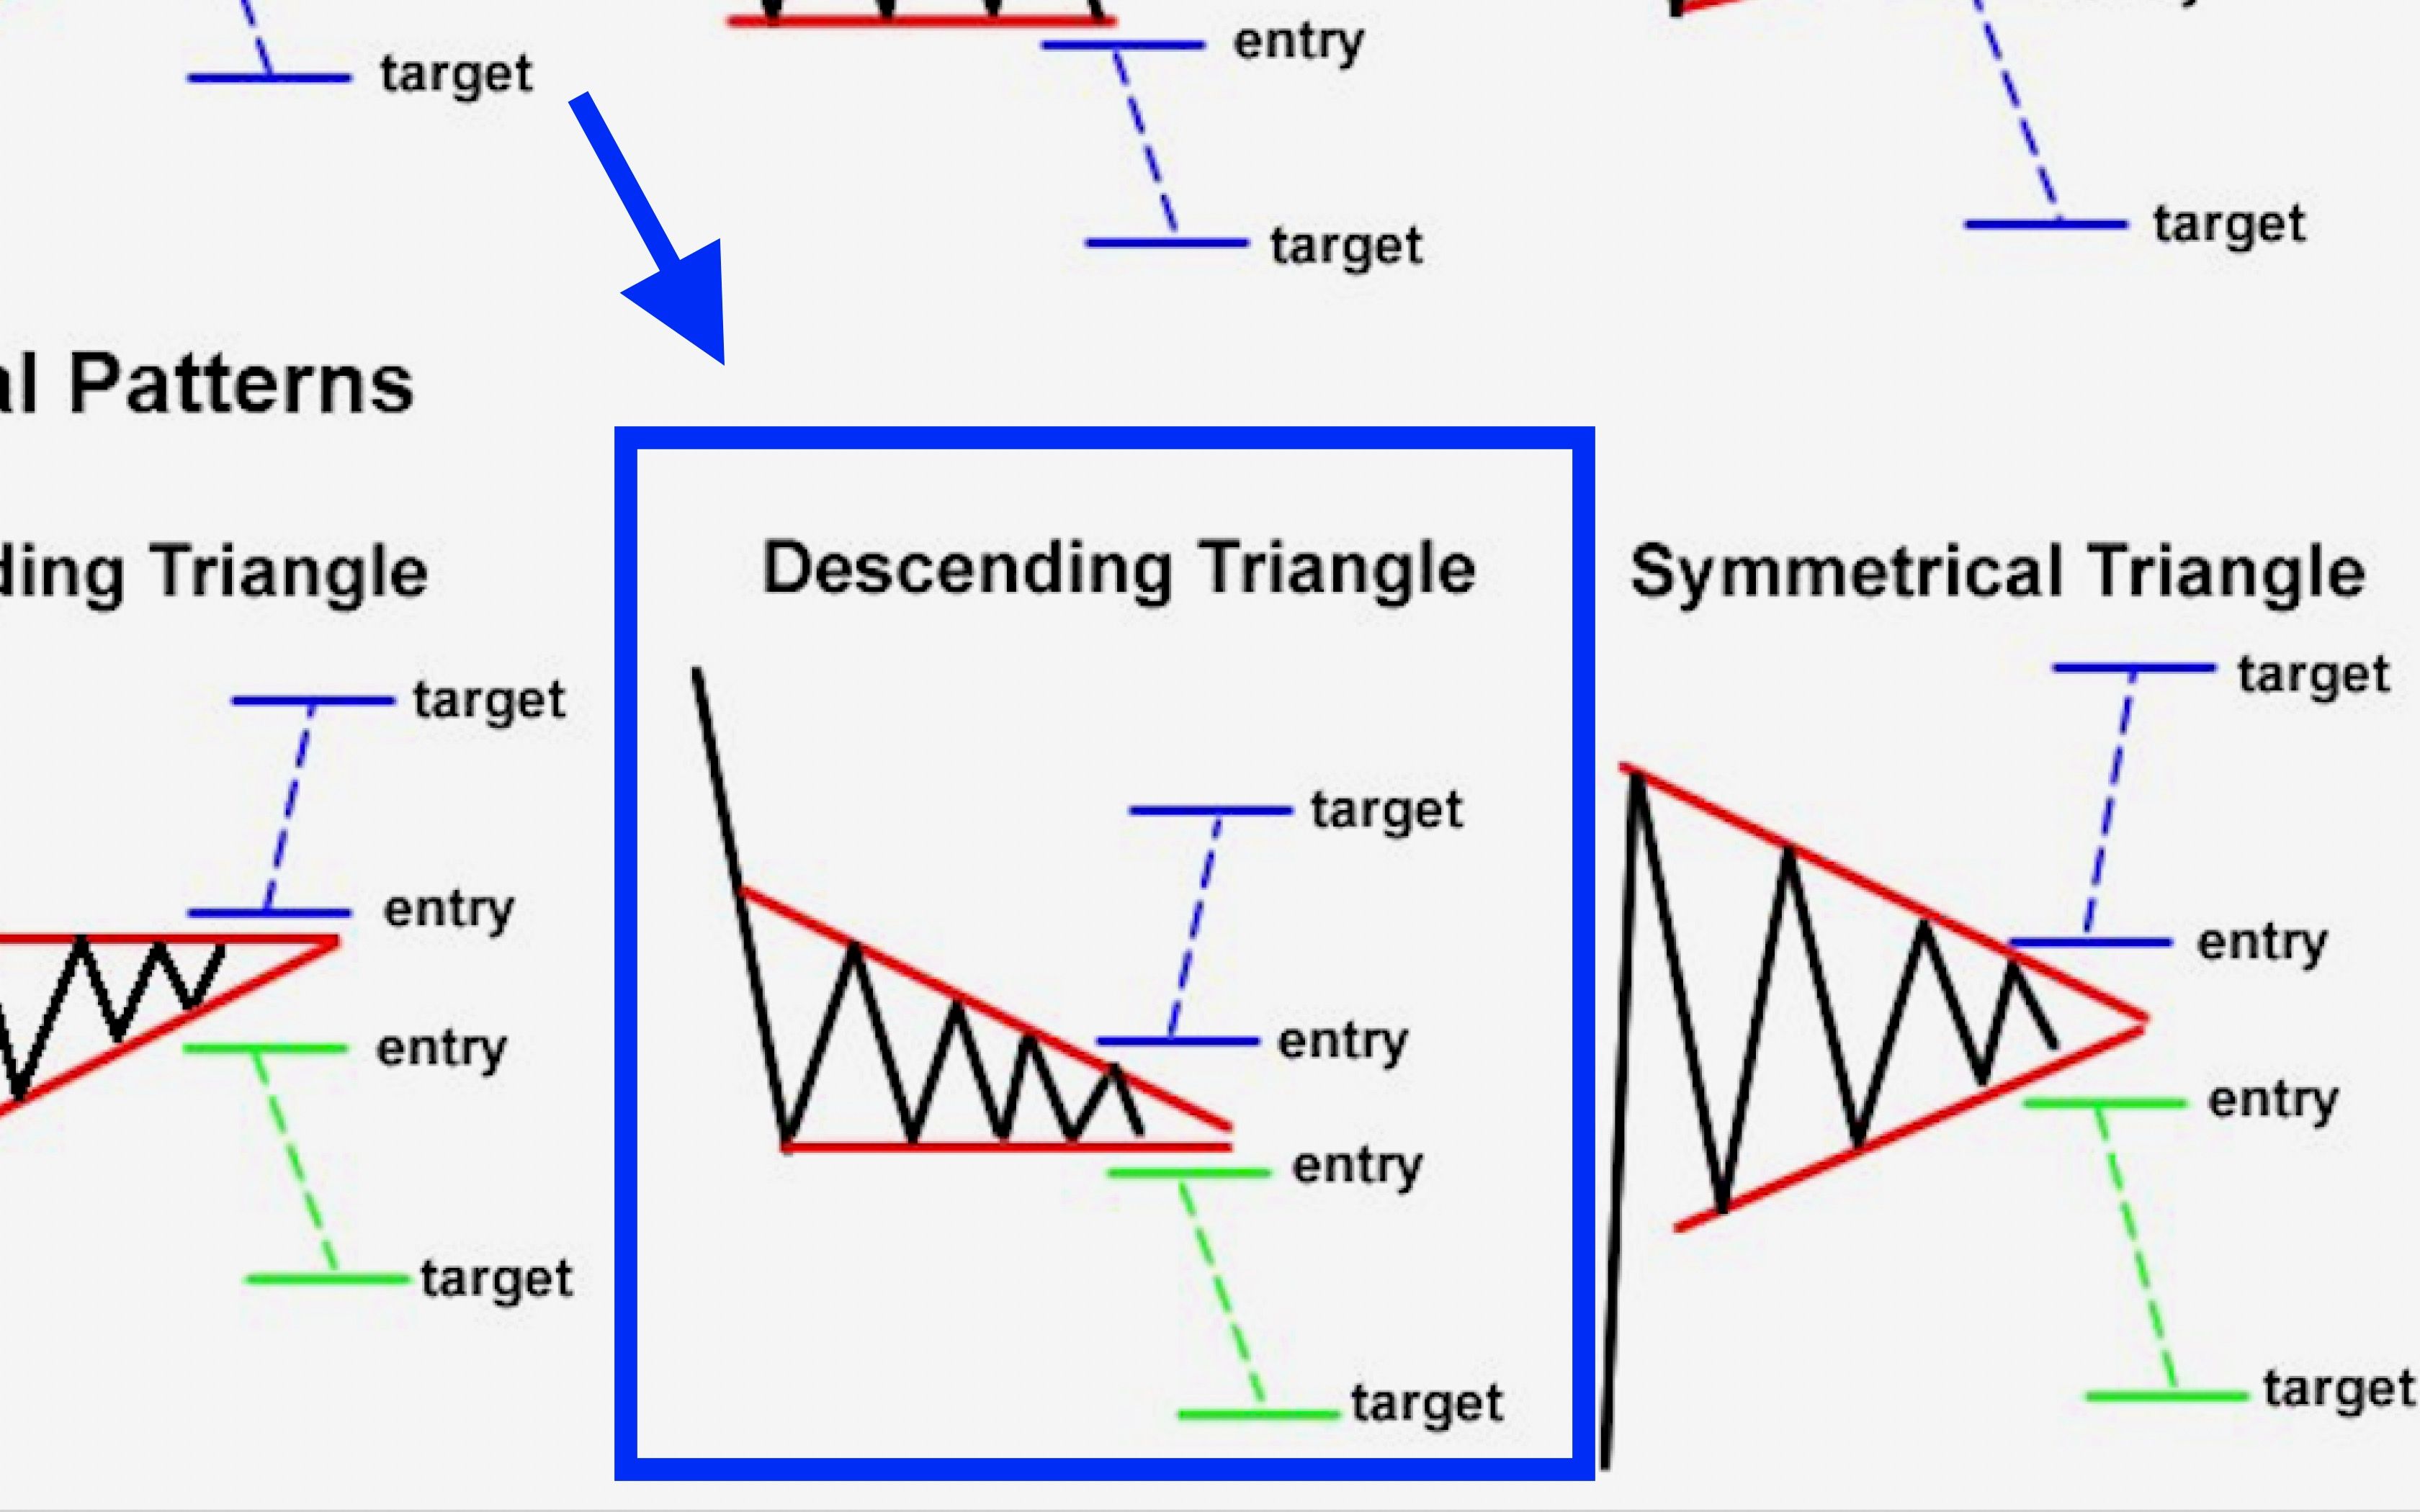 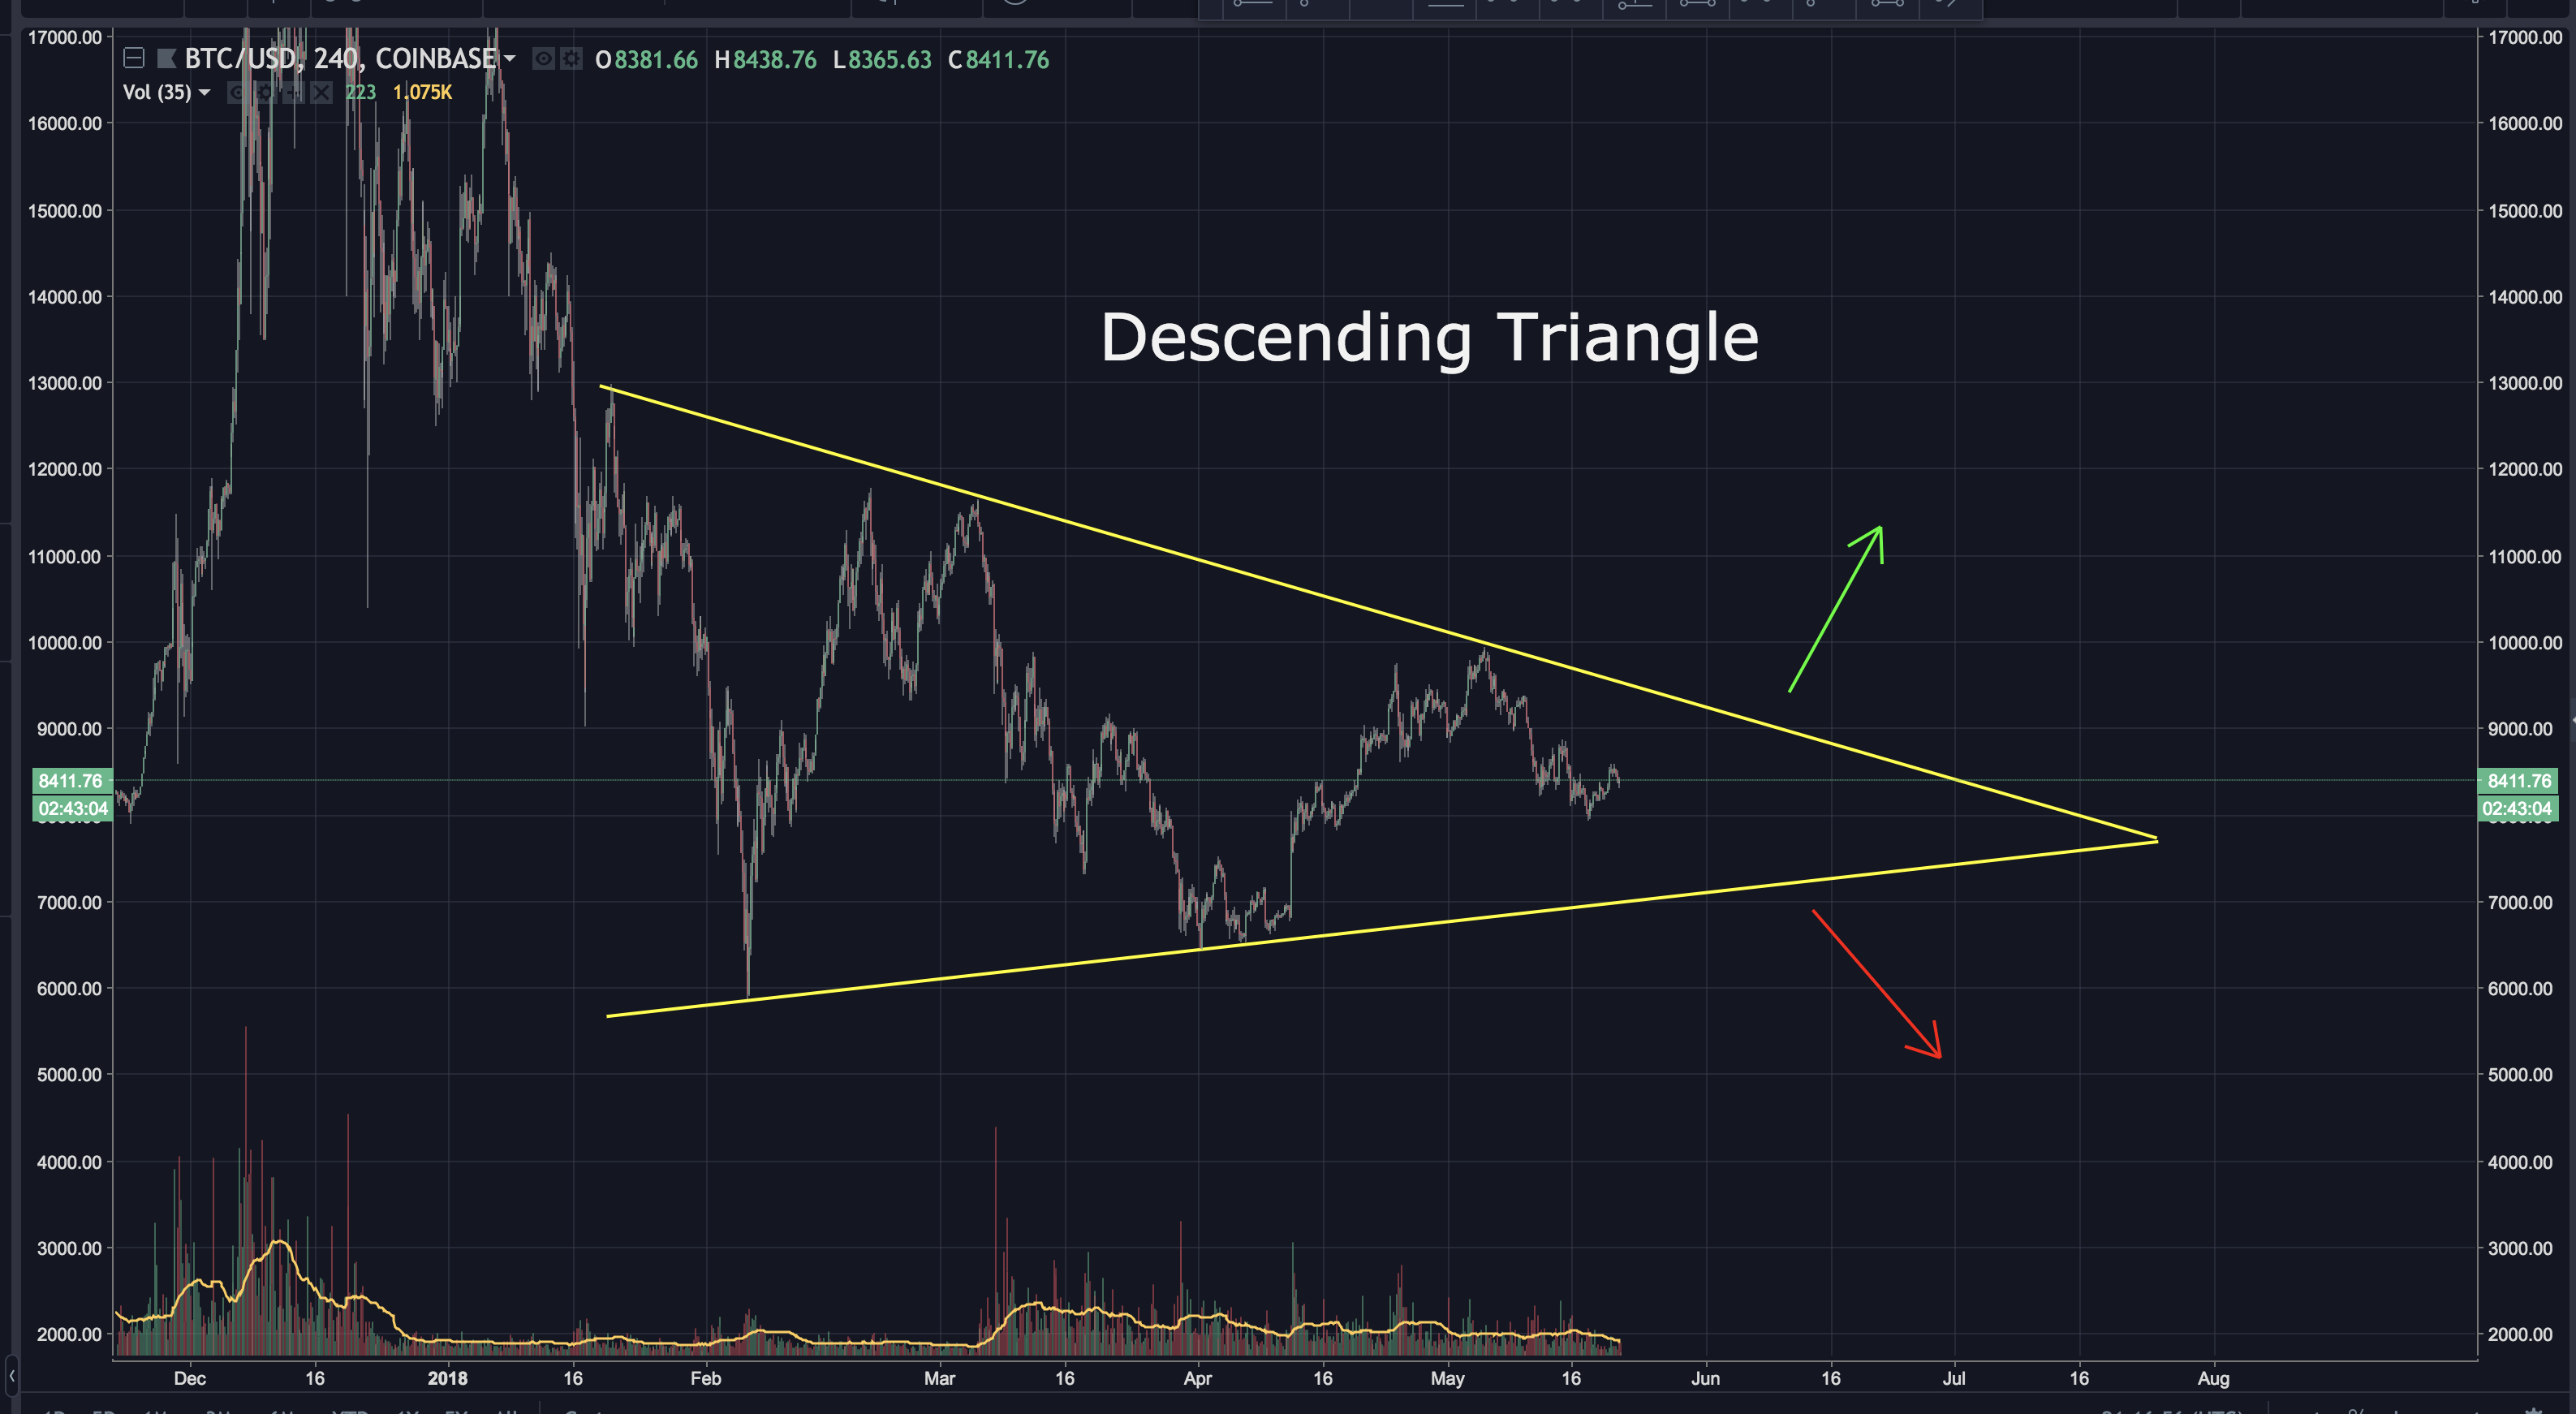 As bitcoin gets closer to the triangle's apex, a breakout becomes more likely. Looking at the apex, one could make an educated guess that a breakout may take place around mid June. Should it drop, there's strong support at $7,000. If it drops below $7K, the next major support area is found at $6,000. If it breaks up, there's strong resistance at $9,940 and again at $11,400. **BIAS:** Short Term: Neutral Longterm: Very Bullish  **I hope this has been helpful. I’d be happy to answer any questions in the comment section below. Thanks for stopping by.** ## **If you found this post informative, please:**  *Disclaimer: I am NOT a financial advisor and this is NOT financial advice. Please always do your own research and invest responsibly. Technical analysis is simply a guide. It doesn’t predict the future. Anyone that claims they know exactly what’s going to happen is foolish, lying or both. Technical Analysis should only be used as a tool to help make better decisions. If you enter a trade, I recommend having a stop loss and sticking to it. You will loose at times. The key is to have more wins than losses. With that in mind, I wish you great success.* **If you don’t have an account on Binance, I STRONGLY recommend getting one. They’re usually the first to get reputable coins, have excellent security and second to none customer service. You can sign up here free of charge: https://www.binance.com/?ref=16878853**