Bitcoin Technical Analysis: Could be about to break up, or break down soon?
bitcoin·@xaero1·
0.000 HBDBitcoin Technical Analysis: Could be about to break up, or break down soon?
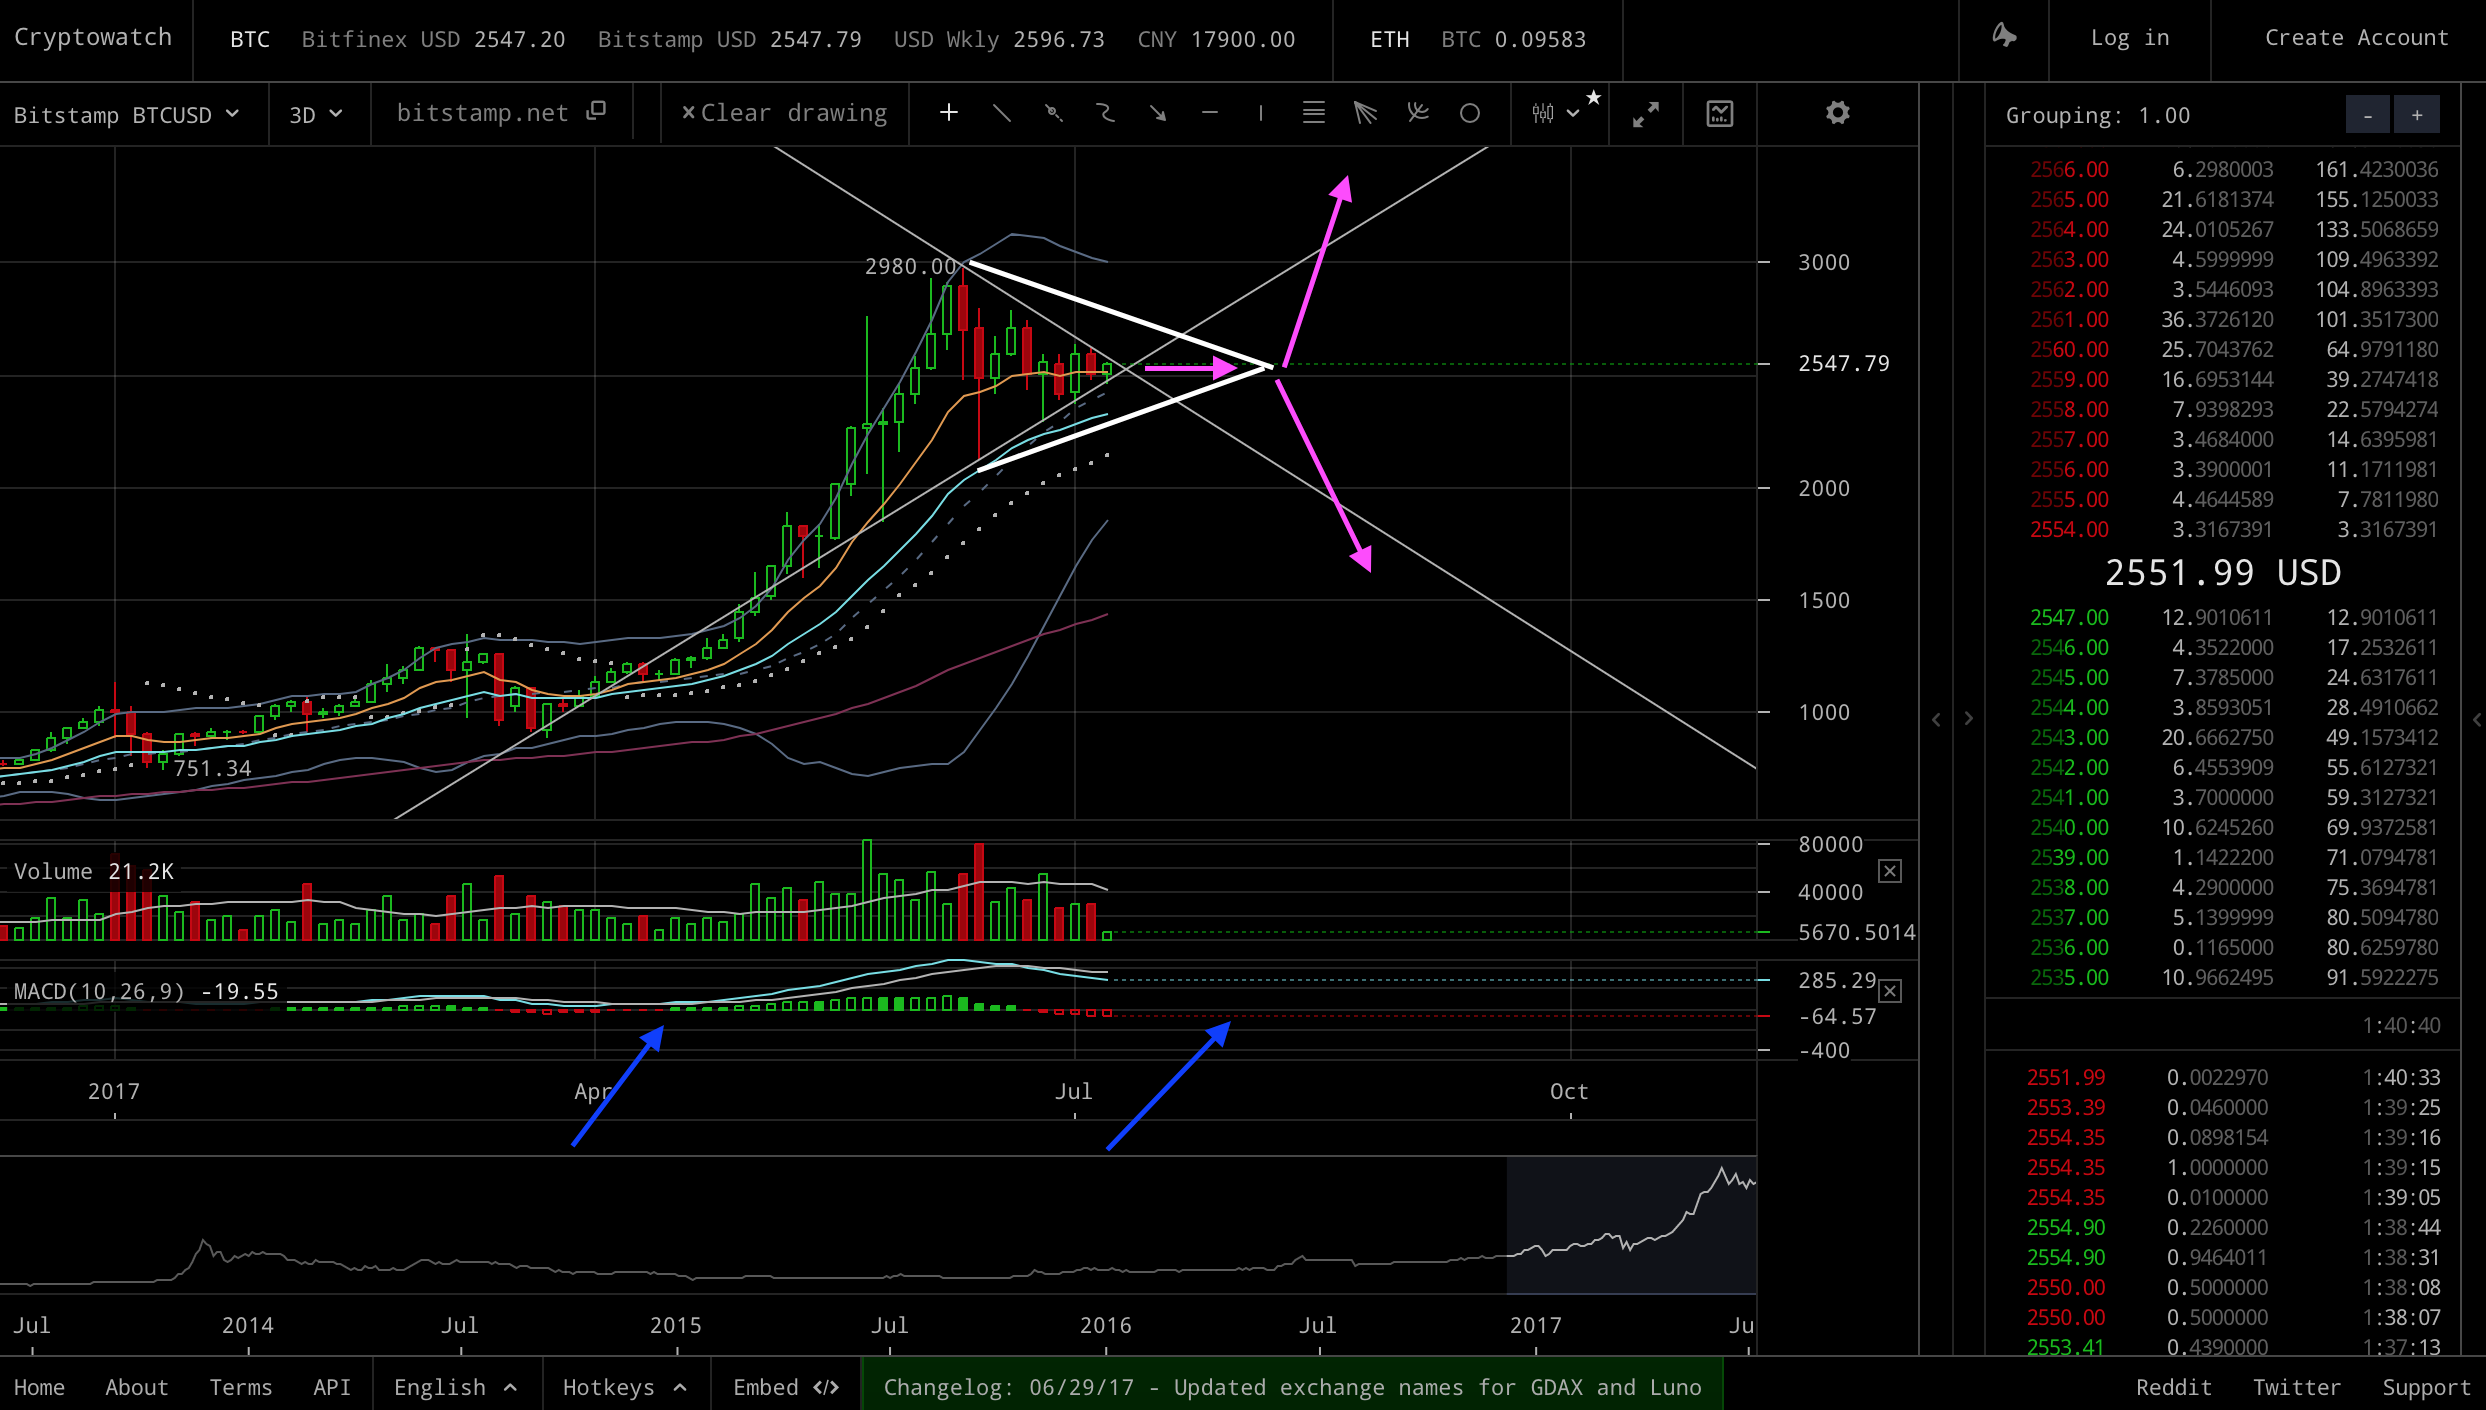
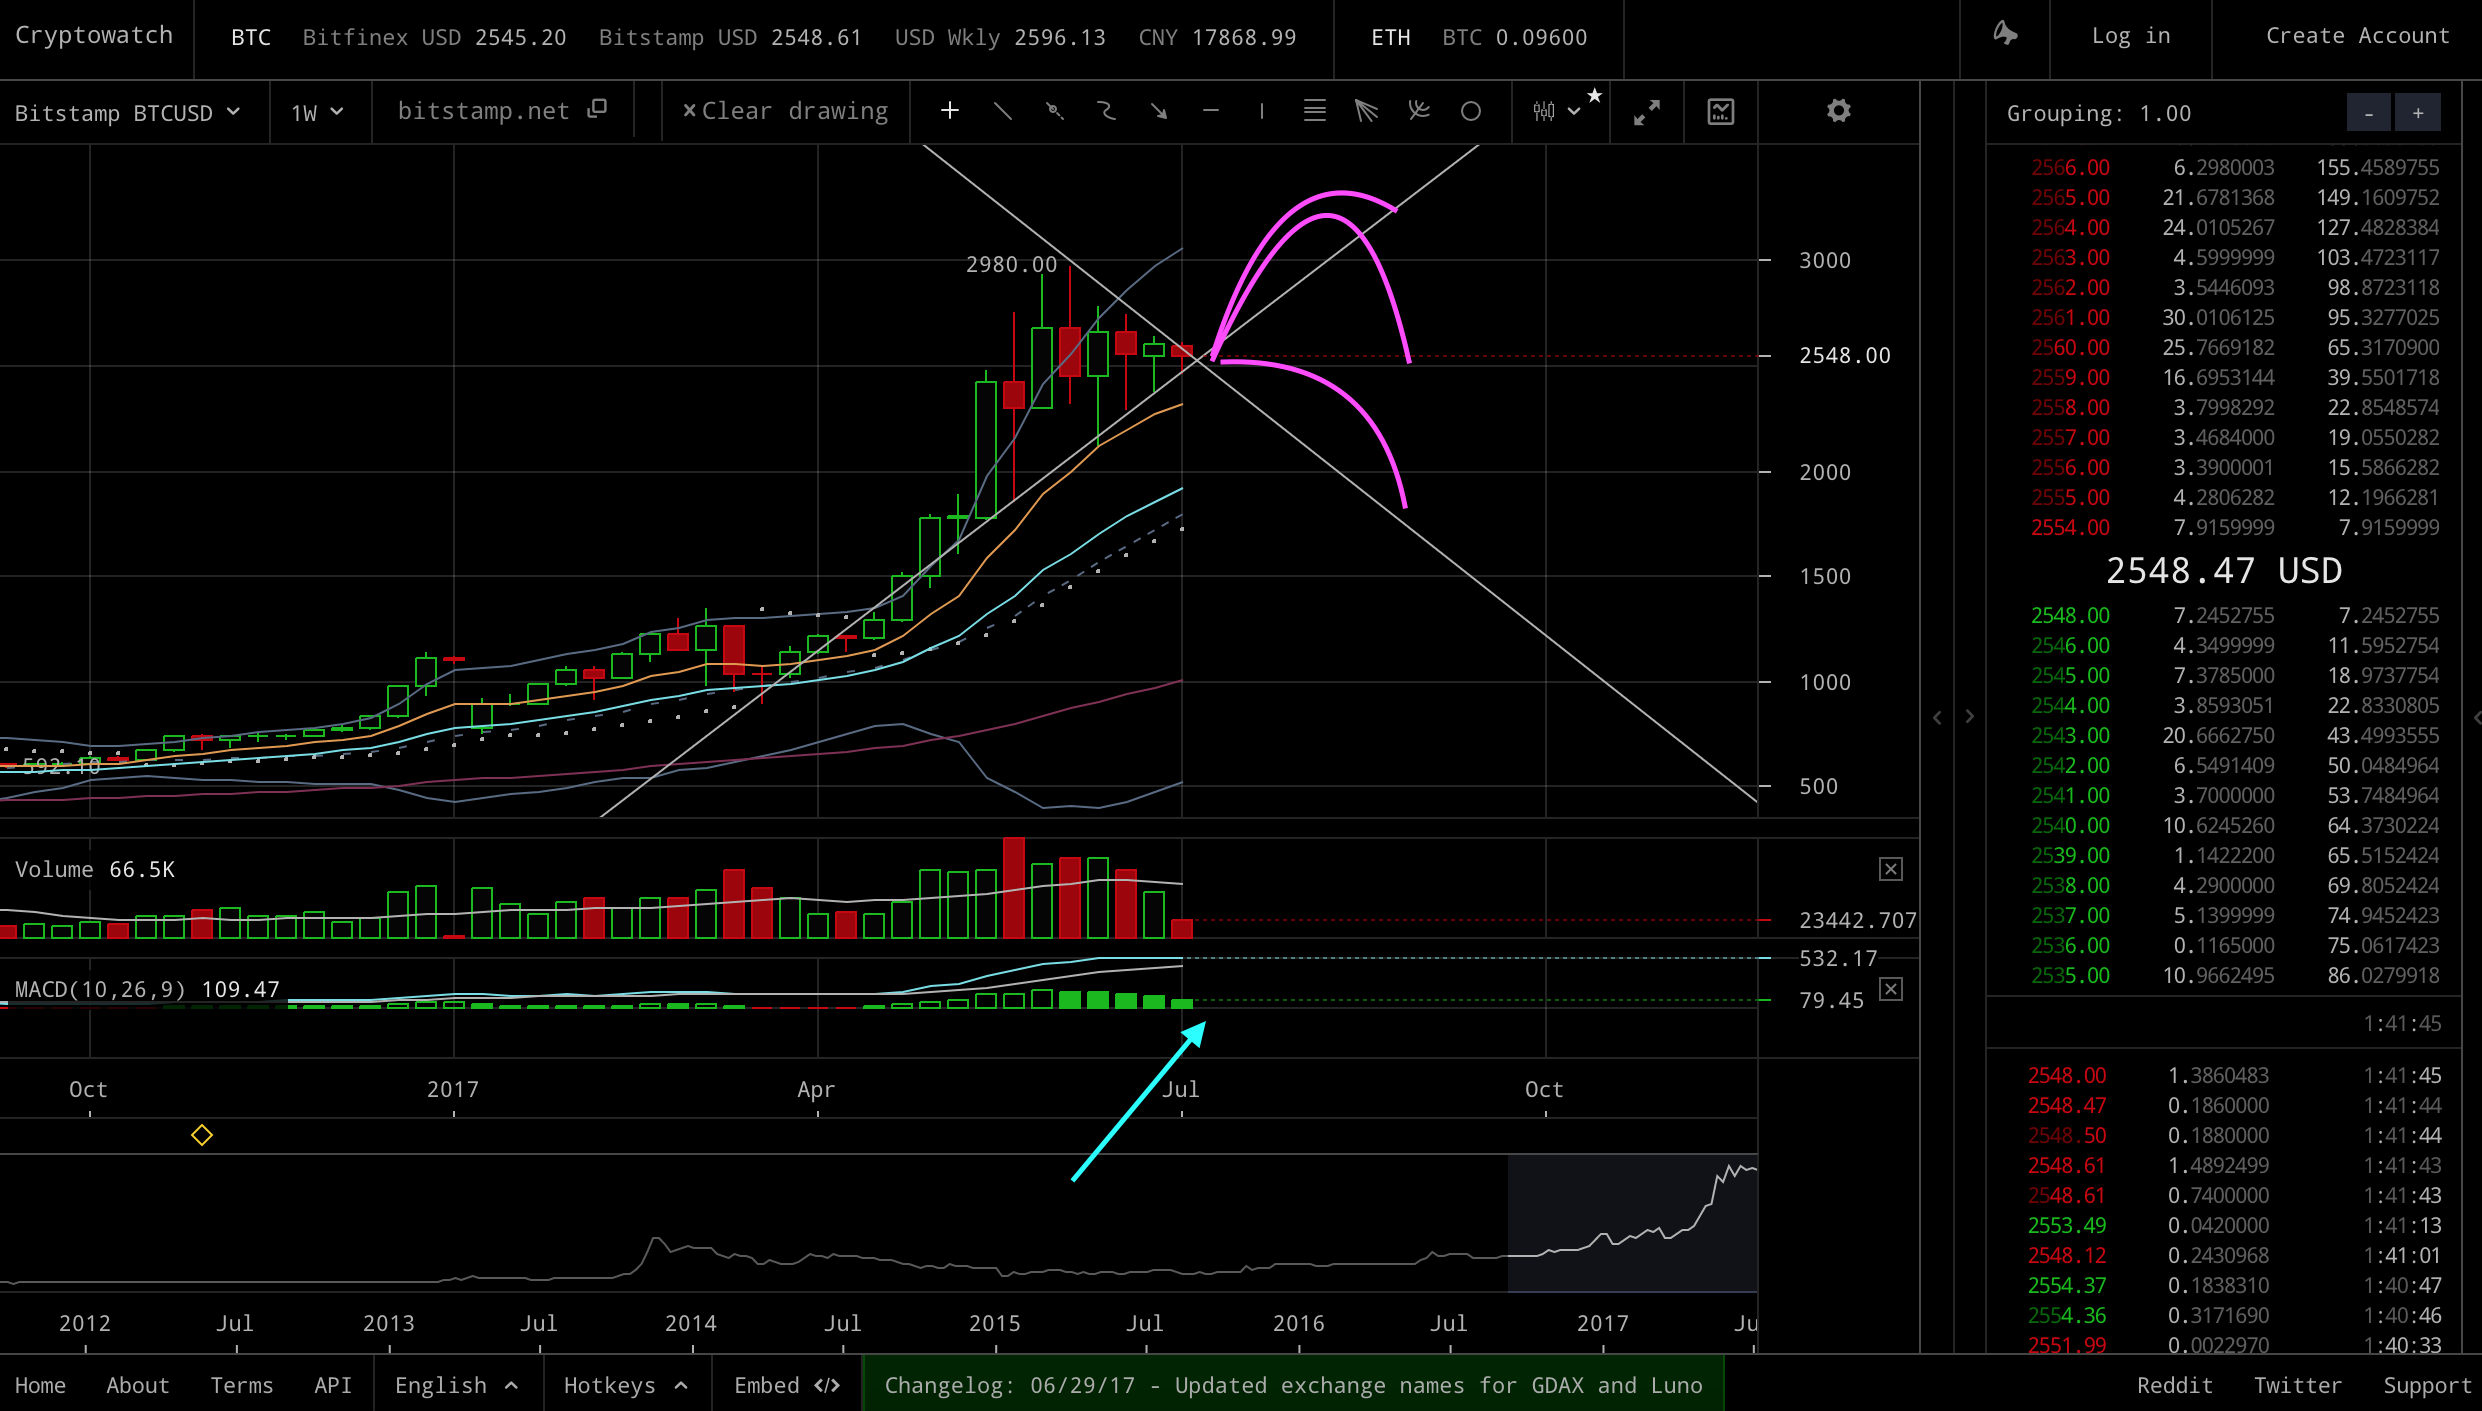
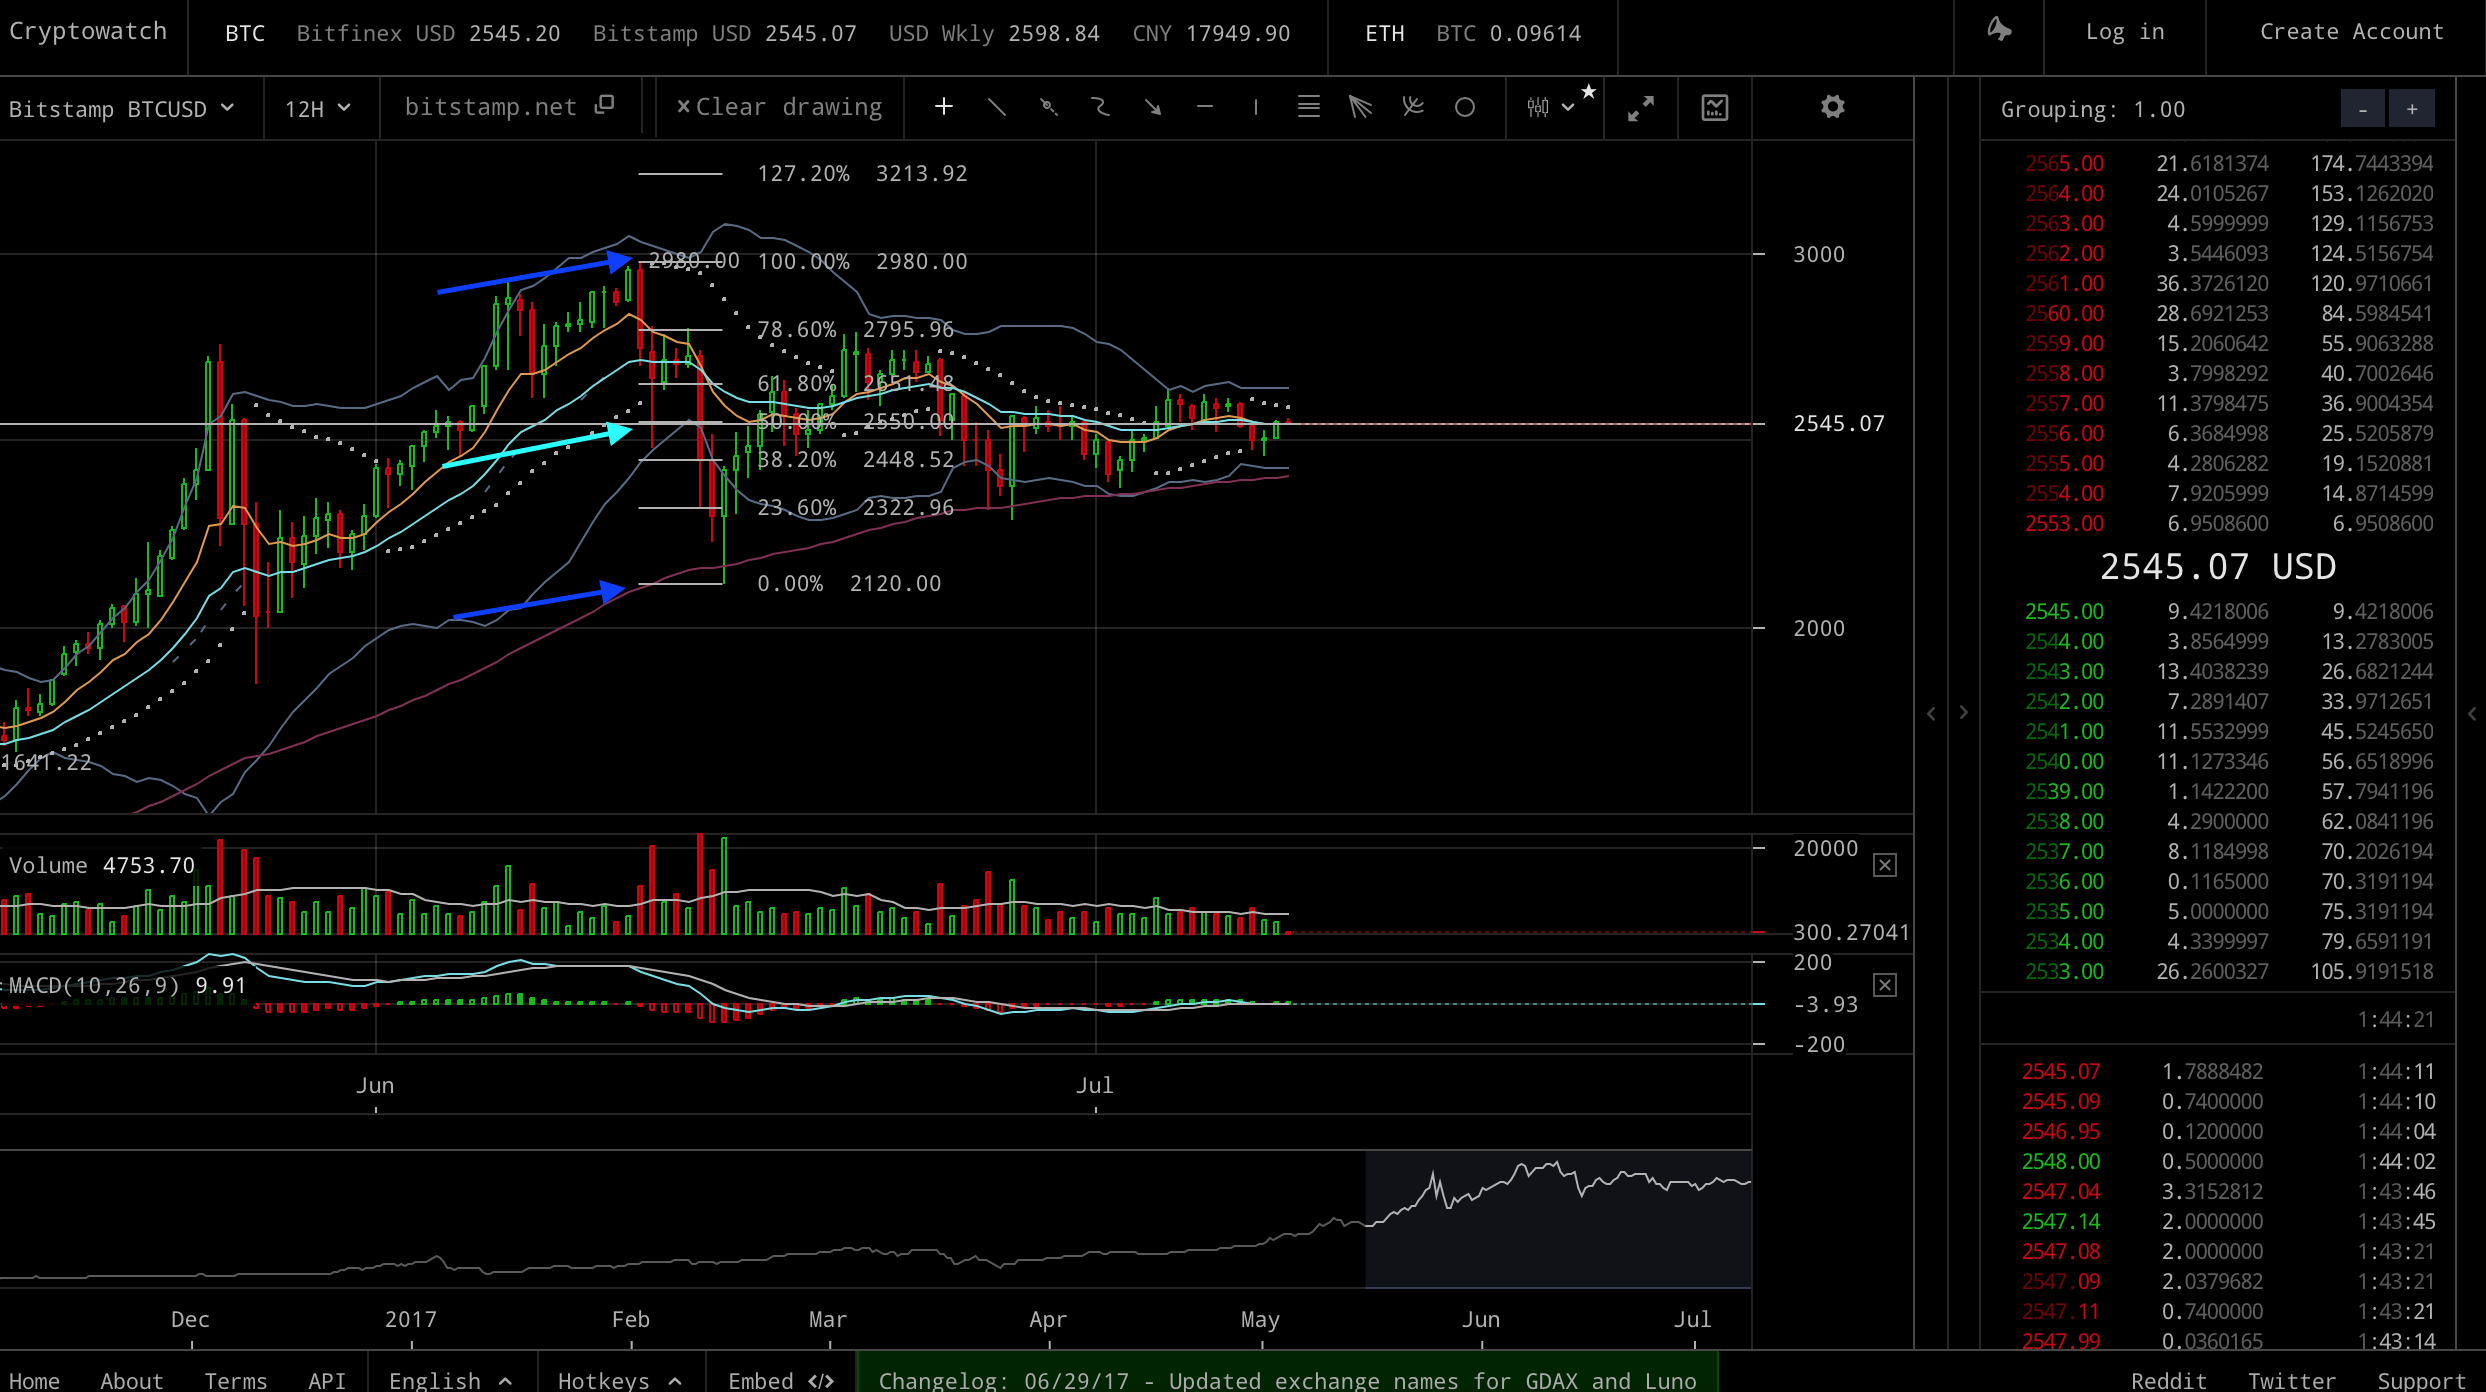
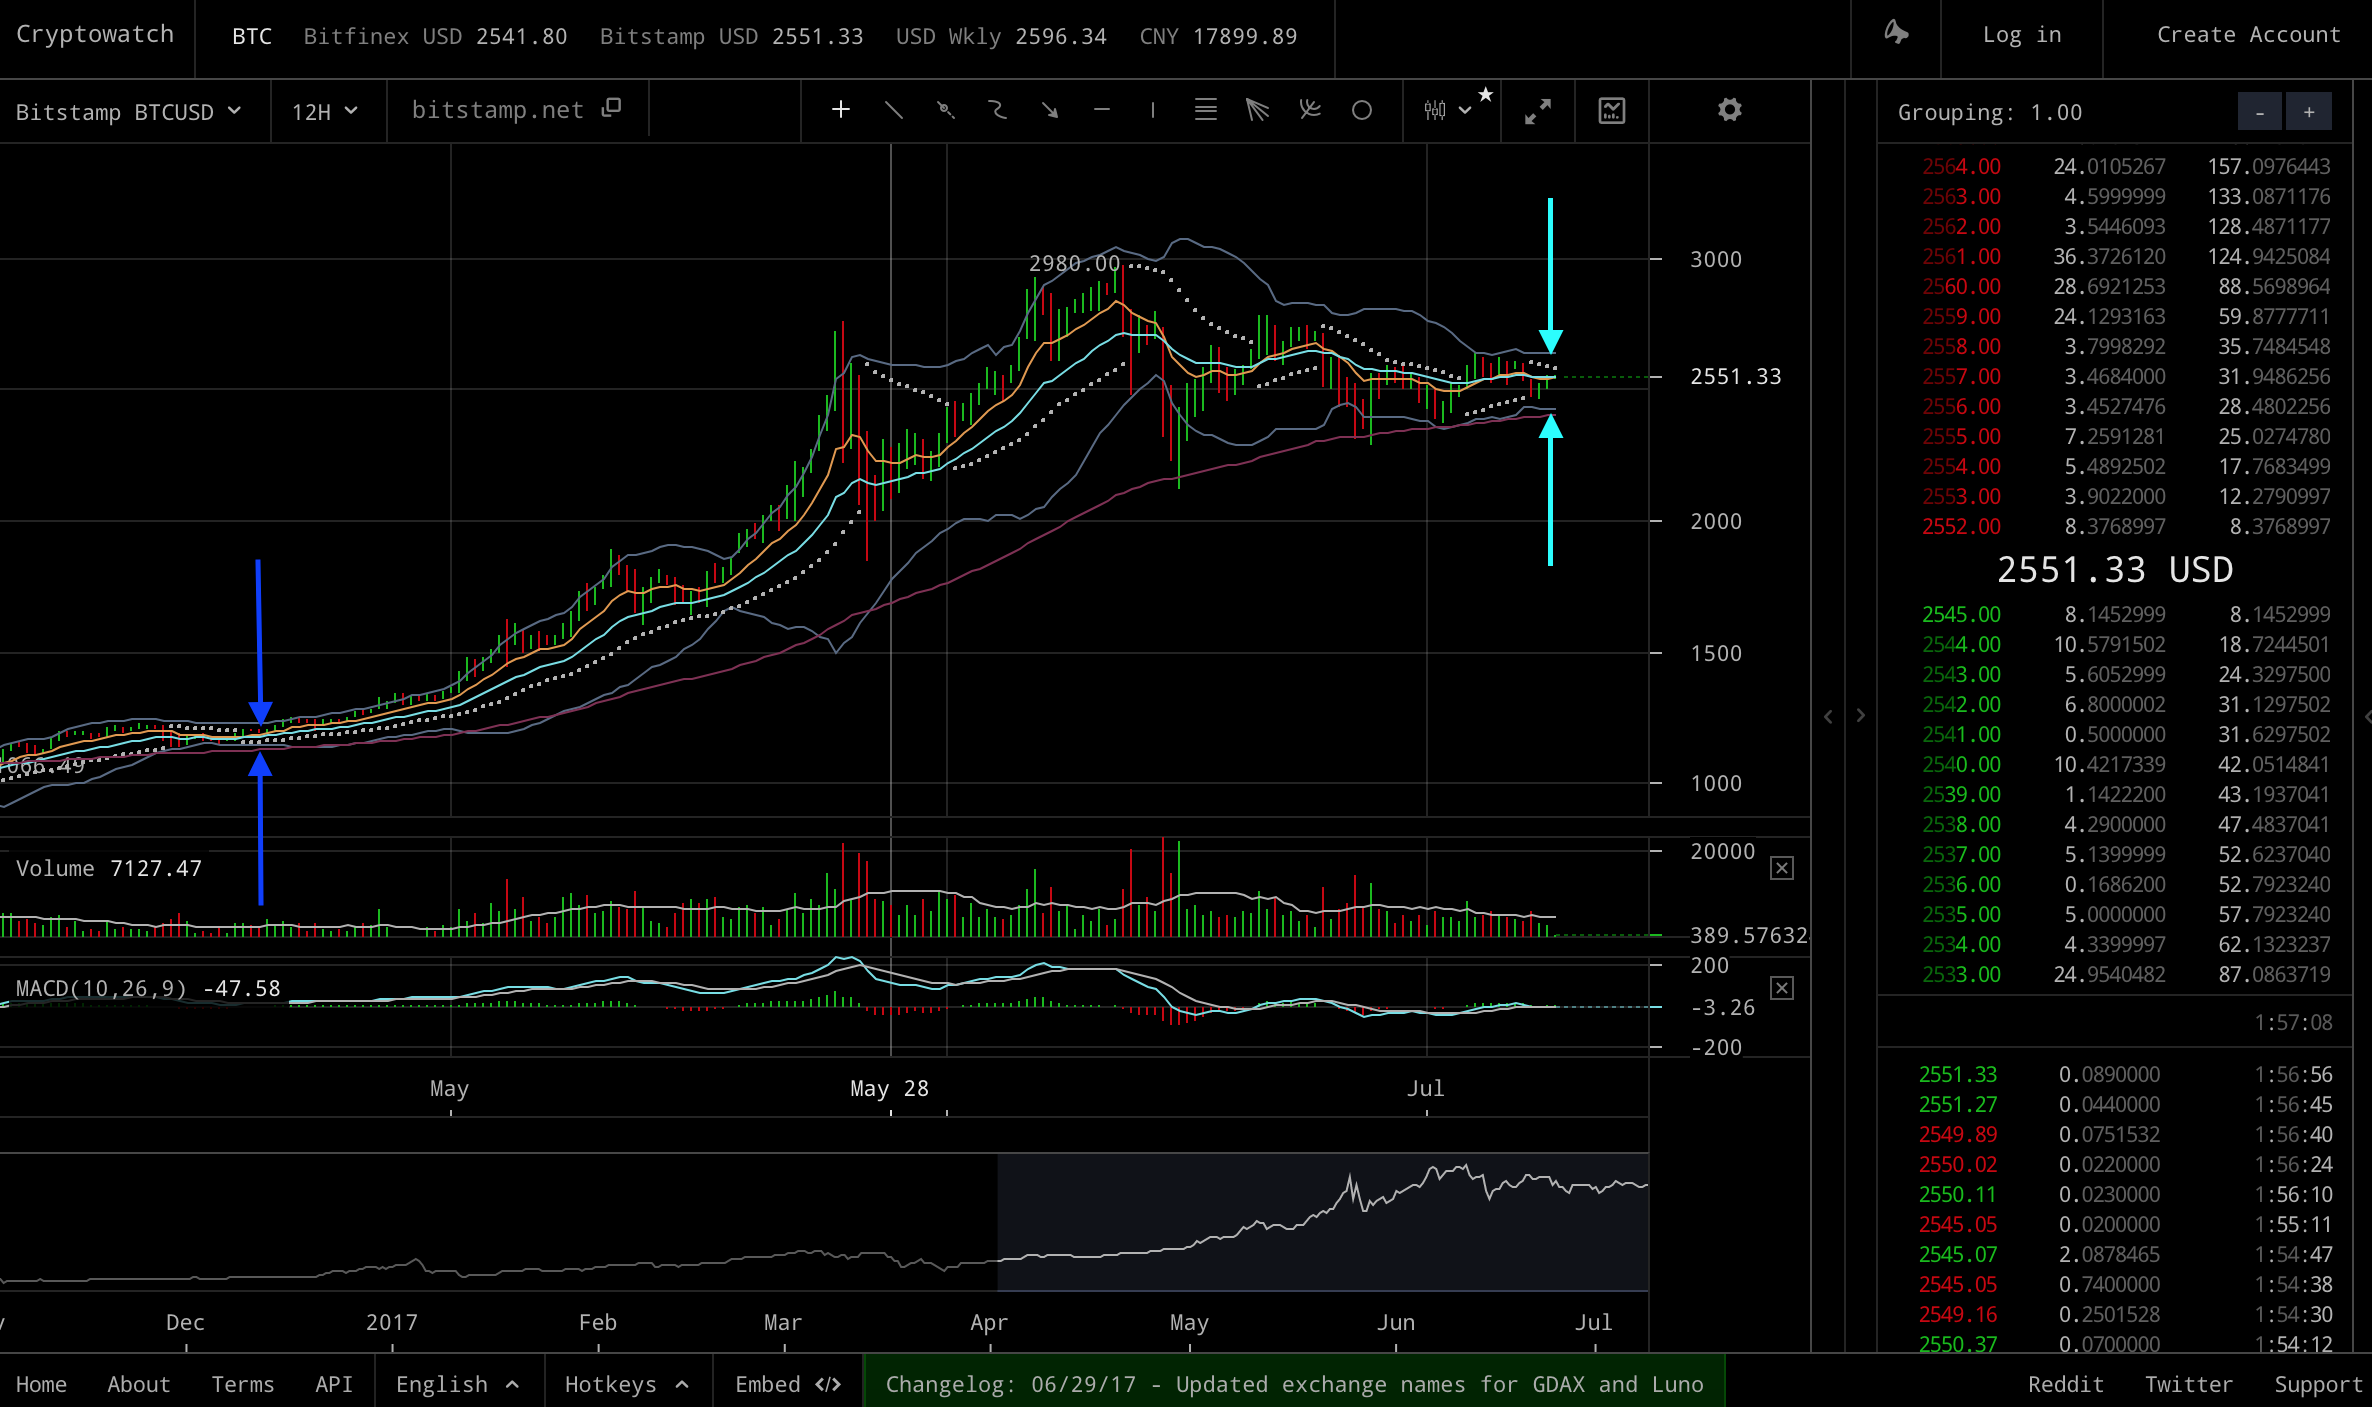
Bitcoin loves triangles! Whenever we see a large price rise in bitcoin (as was the case from April to June), or a large price drop, a 'triangle' formation may typically emerge during the consolidation period which follows. In fact, in my experience it's pretty strange if one does not occur! The triangle pattern is normally relatively symmetrical around the horizontal (upper edge and lower edge have similar angles), so it's this type of triangle that I look for. Once such a formation has started to emerge, you can try to make money by buying when it hits the bottom edge and selling when it hits the top edge, but this only works if it stays within the bounds you are expecting. The following graph shows just such a triangle which has former during the current consolidation period (Bitstamp, 1-day chart):  To me, this graph is very exciting! This is because it looks like the current triangle is about to end very shortly - on this graph, by around 12th July. And, near to the end of such a triangle, there can be a great chance that a significant break upwards or break downwards may occur. I have shown these possible scenarios with the magenta arrows. I have also placed blue arrows at the previous and possibly next main MACD red->green switch-overs. However, we are of course not *guaranteed* that a big break up or down will occur at the end of such a triangle. What might happen in the case we don't get one? We may get a smaller movement up or down, but not one that is significant enough to mean that the consolation period has finished. In this scenario it can be possible that we just get *another* triangle pattern forming, but with a resolution point that is a bit further away :) The following graph shows this possible type of 'new triangle' scenario (Bitstamp, 3-day chart):  Again, i've used magenta arrows for the possible price movements. I've used a blue arrow for the main previous MACD red->green switch-over, and another one to indicate as a guess where we might see a next switch over. This MACD red->green switch over is a key indictor to look for, for a move upwards. As we can see from this chart, however, we're still in the 'red' zone, and a red->green switch over does not look that imminent - so this chart might point to an immediate significant break upwards being less likely than with the previous chart. Next, let's look at the 1-week chart (Bitstamp, 1-week):  On this chart, we see that the MACD is still in the green zone. However, it's falling (shown by the cyan arrow), and this is not such as positive signal, because it might point to a green->red switch over in the not too distance future. But it's also possible that we could stay in the green zone for a long time with multiple 'bulges' occurring. I've marked some possible scenarios for the price based on this chart with three magenta lines. The first one shows a rise, but because of the falling MACD, I would probably not expect it to be of the same magnitude as the previous recent rise (3x)(!) For example, a 1.5x increase from the most recent peek would take us to around $4500 (but I think that's perhaps pretty optimistic!). The next scenario shows the price increasing, but dropping right back down to where it started. This one would be consistent with the 'head and shoulders' formulation - but this is a negative indictor for what happens next, because that part is downwards, if the formation is correct! Finally i've drawn a third line for the case that the price just drops from where it is now. The next graph shows the Fibonacci retrace levels for the current consolidation period (Bitstamp, 12-hour chart):  I've marked blue arrows at the highest ($2980) and lowest ($2120) levels, and I've marked a cyan arrow at the mid-point (i.e., 50% re-trace) ($2550). Now, this chart is really absolutely amazing :) The reason why I say this, is that after the whole consolation period we have (just now) end up at just about exactly the mid-point between the recent top and bottom prices! Why is this so amazing? Well, to have made (a lot of) money during this consideration period, all you would have needed to have done would have been to have place buy orders between 2120 and 2550, and sell orders between 2550 and 2980. Or another way to do it would have been simply: buy when the price the price was below 2550 and sell when it was above 2550. This only works, of course until the consolidation period finishes, and it break up / break down (which I was discussing earlier) occurs! My take on perhaps why we very frequently see these triangle formations and consolidation at the 50% retrace level, in bitcoin, is that many traders and automated trading systems predict this same pattern and therefore trade accordingly, which then gives the pattern a very high chance of being full-filling ;) It's easy money if you can just convince yourself these same patterns which have occurred in the past will happen the next time you're trading. Finally, I'd like to quickly discuss the current Bollinger bands, shown in the following graph (12-hour Bitstamp chart):  As well as triangle patterns, MACD, and Fibonacci, Bollinger bands can be one of the most important indictors for a break-out (up or down). For my experience, the tighter the bands, and also sometimes the longer that they have had this tightness, the greater the movement will be when the break up/down occurs. Like with the MACD indictors, though, you need to decide which time-frame you think is going to serve as the best indictor. On this graph, I've marked the B-Band separation at point which preceded the previous rise with blue arrows, and I've marked the current B-Band separation with cyan arrows. As can be seen, on this time frame the B-Bands have not currently tightened to the same level as they were before the previous rise (although perhaps I should be using a log chart for better accuracy here). A quick take on this might be: If we were to get a break out soon, then the magnitude might not be that great because we didn't start off from very tight B-bands; another take might be that it perhaps not unlikely that our consolidation period might continue longer. So what's my trading plan? I intend to look for any a sign of a break upwards out of the current triangle, as we approach the end of it - and if i see it, I plan to buy some Bitcoin! In the case of a downward move, I probably won't be doing that much since I'm already sitting in more fiat that crypto, and shorting isn't really my thing. Instead, I would try just try to buy back in lower / try to catch the bottom of the correction (although this is never easy!) Overall, I guess my instinct is a bit towards the negative direction due the falling 1-week MACD, as well as possibly falling volume which I haven't discussed here - but, I'm still hoping for a rise! Please let my know if you have any comments or suggestions for corrections to this post. Thanks, and happy trading! DISCLAIMER: The material in this post does not constitute any trading advice whatsoever. The reader should not make any trading decisions based on anything in this post, and must take completely responsibility for any trades they may decide to make after reading this post.
👍 xaero1, amartinezque, weareourdesires, gavinthegreat, rhino, clusterr, sosolala, plissken, rexbas, shirish5, daxed, gatmi, kevbot, swaraj, attalis, dienhassan, robyop, altcointrends, zavulon, zerometal, king-crypto, lgfurmanczyk, hastla, freshstuff, challengerdll, freiheit50, shiroeiroe, ryn, trafalgar, whaleshare, runningtree, fikri, ekp248, scandinavianlife, simeonburke, makeithappen, fiss, classydapper, akariko, omarfaruk, filipgrad, embracingchaos, onealfa, giosou, tinaungmoe, zeteticmindset, coolgirl, hansen7, lawrenceho84, awesomo, lordoftruth, blazing, cryptokraze, arronax, alyssas, icebird, ayunda, randomvideos, crypto-ta, cityslicker, edianur, jeraying, fahmi, yourahea, simkaur, snowapl, d-pend, wahyu07, noticierobitcoin, educ.leb, maikegrell, dojeda, steemitboard, slickhustler007, jen8, beatriz, lazarescu.irinel, nolameca, me-do, book-zangyi, kryptokayden, chingpherd, dreamiely, ipkiss, rkaz, ades, mdquixil, andyx, fahrullah, imamaii, mursin, khim, roosegr, fira, zuraini, perfect-trader, momin109,