A pump and a dump - A quick look at HIVE price
hive-175254·@culgin·
0.000 HBDA pump and a dump - A quick look at HIVE price
A massive pump and a dump of similar magnitude. Now what? I am of course talking about the price of HIVE. HIVE went on a parabolic run and saw its price increased from a recent low of 1500 sats to as high as 12888 sats. A remarkable 750% increase over a span of 4 days as shown in the chart below. <center>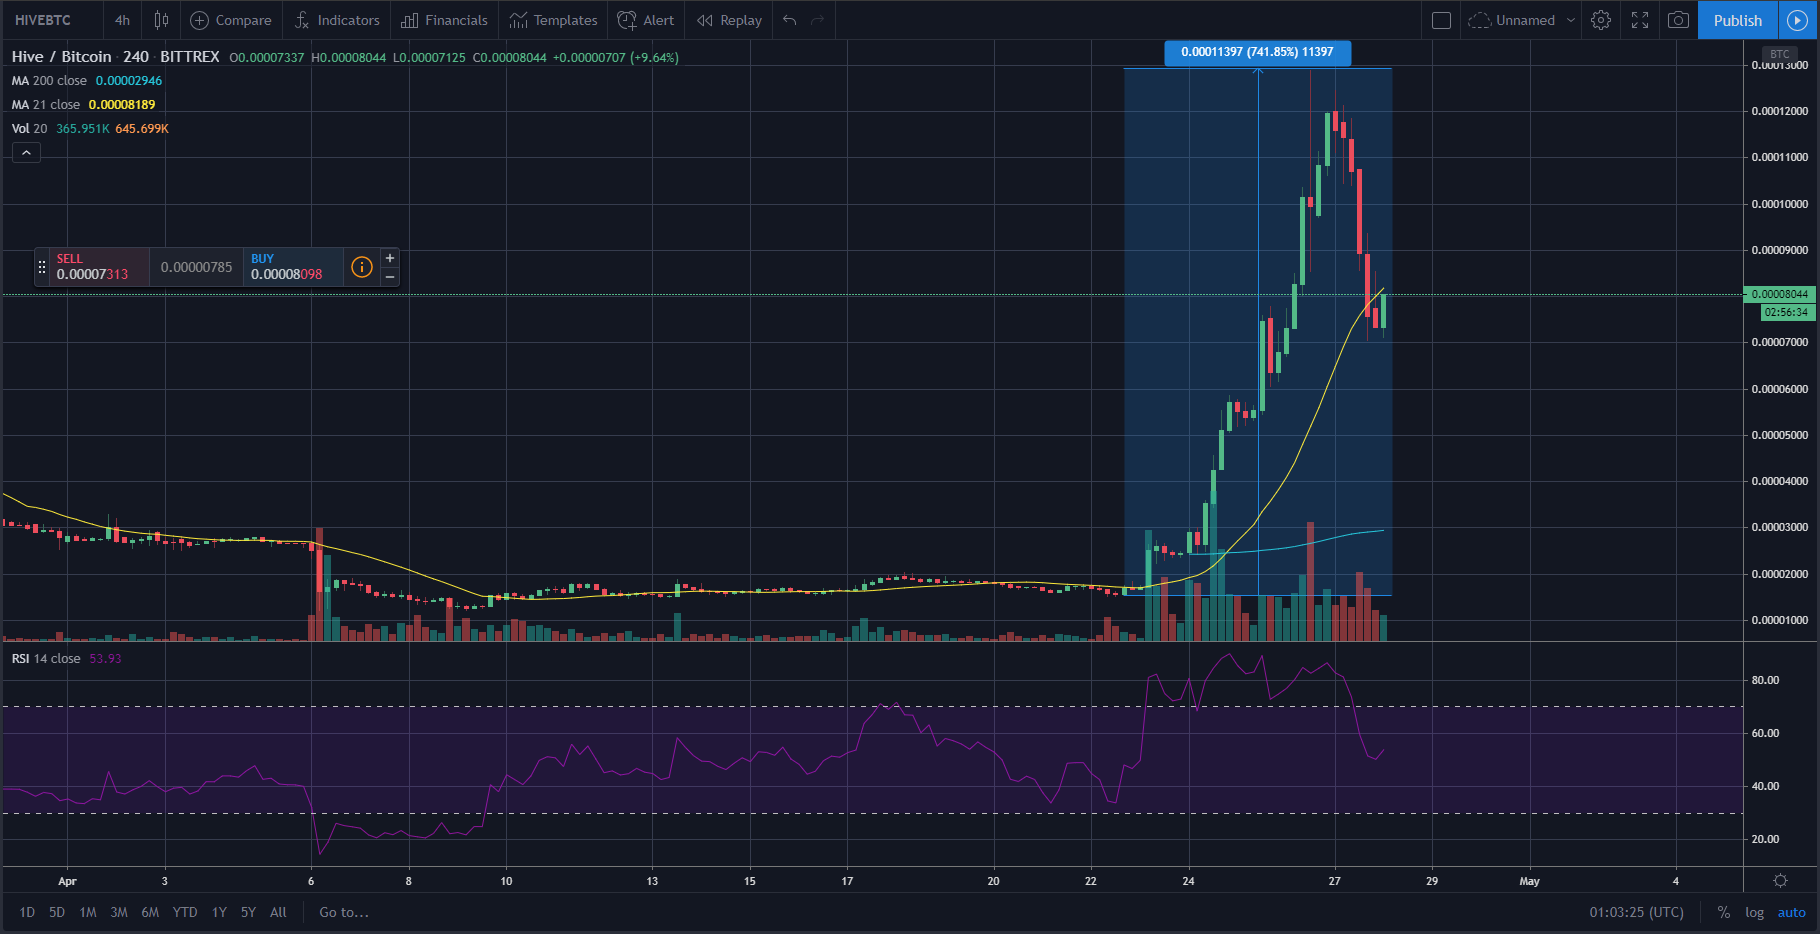</center> --- ### A look at HIVE price I have refrained from writing about HIVE's price during the run up because I know such a parabolic rise is unsustainable and will eventually need to take a breather. In addition, HIVE's chart is a very "young" one with insufficient historical data for a proper analysis. I usually like to analyze on the bigger time frames, but for HIVE, I have to use the hourly charts for analysis. In any case, at the point of writing, HIVE price has corrected. <center>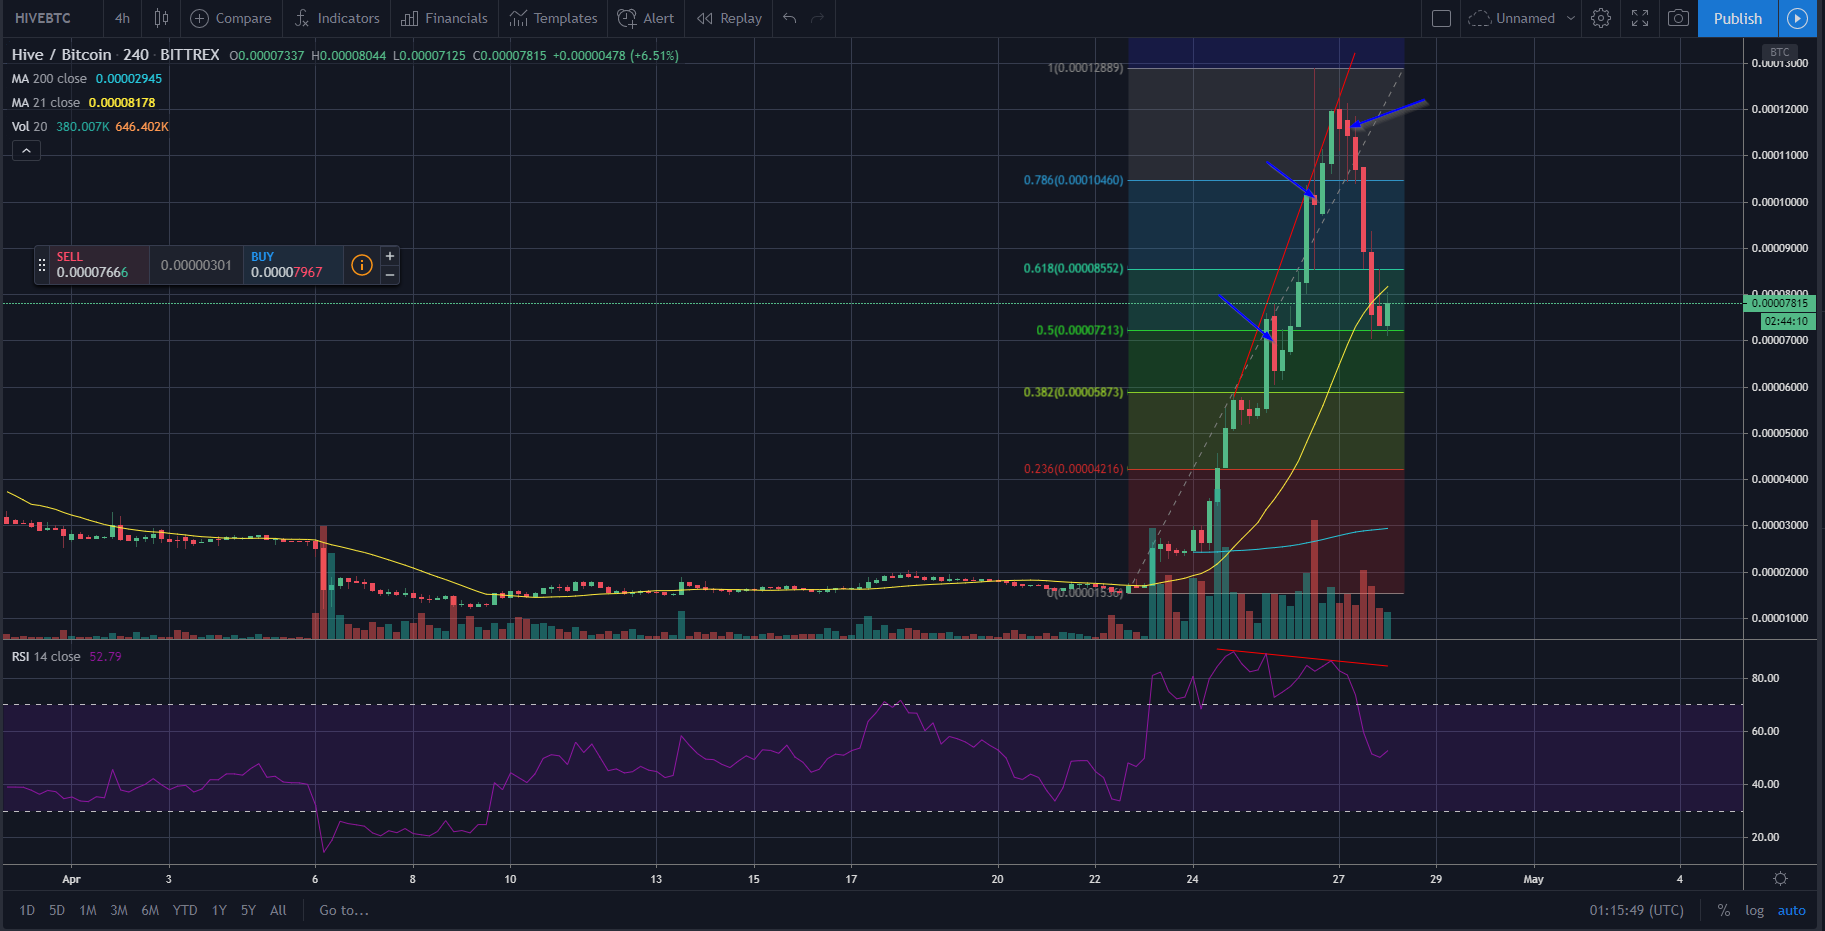</center> As you can see from the chart above, the HIVE price has retraced to the 50% fibonacci retracement level. It is now hanging on to that level and attempting to test the 21 SMA on the 4H chart. I also want to point you to the trendlines in red I drew on the main chart itself and the RSI. Such a pattern is known as the RSI bearish divergence. It is used to signal a loss in buying strength and a tendency for reversal. I commented in various posts that I would love to capitalize on this pump and sell some of my HIVE to buy it back later at a lower price. However, most of my HIVE are powered up and hence, I couldn't do much. Anyway, when I sell on pumps like this, I will always stagger my trades, i.e. I do not sell everything at one go and I usually divide into 3 or 4 portions to sell. This is simply because you never know when this pump will end. On the chart above, I indicated with blue arrows the 3 points where I would have sold my HIVEs. Those are points where the RSI set a lower high and took a turn down signalling a potential turn in momentum. So largely, I would have sold at the 7000, 10000 and 11500 sats levels. --- ### The 50% fibonacci level If I have sold some of my HIVE, I would be looking to buy them back when the chance comes. I would have bought back some at the 50% fibonacci retracement level, i.e. now, as it is also in the range of the 21 SMA on the 4H chart. Again, I will split into multiple tranches to buy. **Note that this will just be a trade to catch a potential bounce**. Unfortunately, I did not get to sell any of my HIVE and hence, I am just sitting on the sidelines now. The 50% fib retracement level is usually a good entry to catch the next bounce before a ticker slides to lower lows, especially after a parabolic run. The TSLA (Tesla) price chart is a good example. TSLA had a recent parabolic run and I think some of you was probably tracking it previously. <center>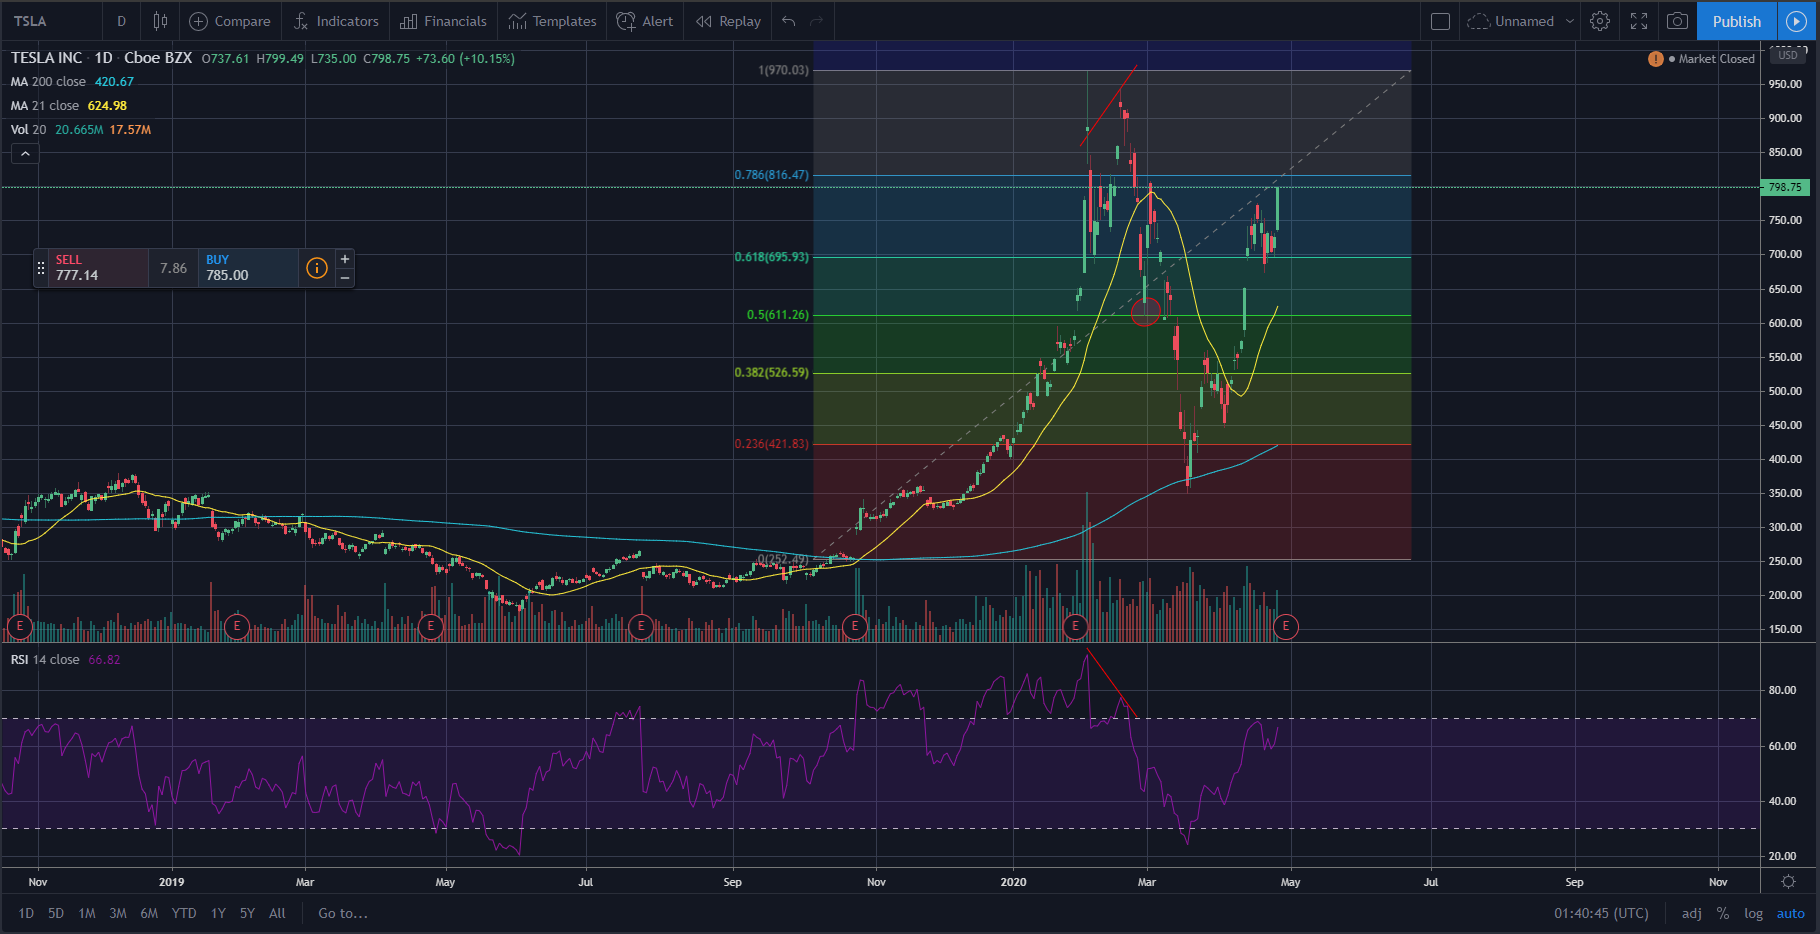</center> As you can see from the TSLA chart, it too had a RSI bearish divergence and went to the 50% fib retracement level. It then bounced up briefly before making lower lows. I circled the point to enter in red on the chart. Similar things happened to BTC and ETH too. Charts below. <center>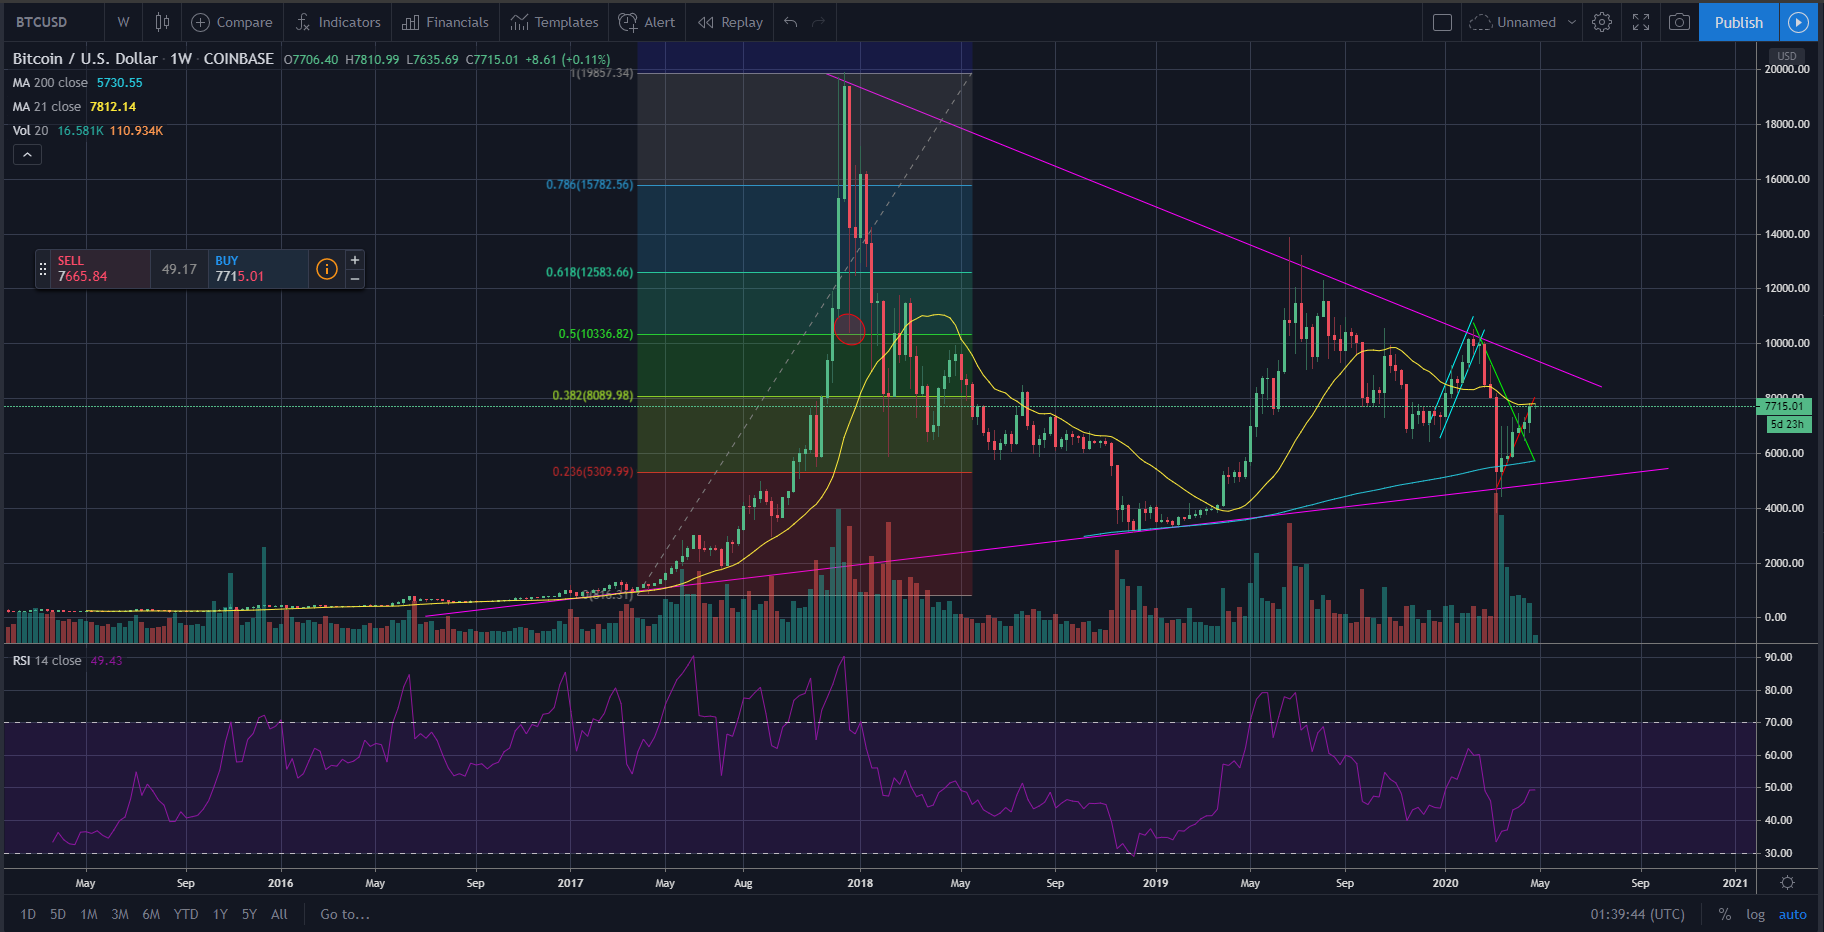</center> <center>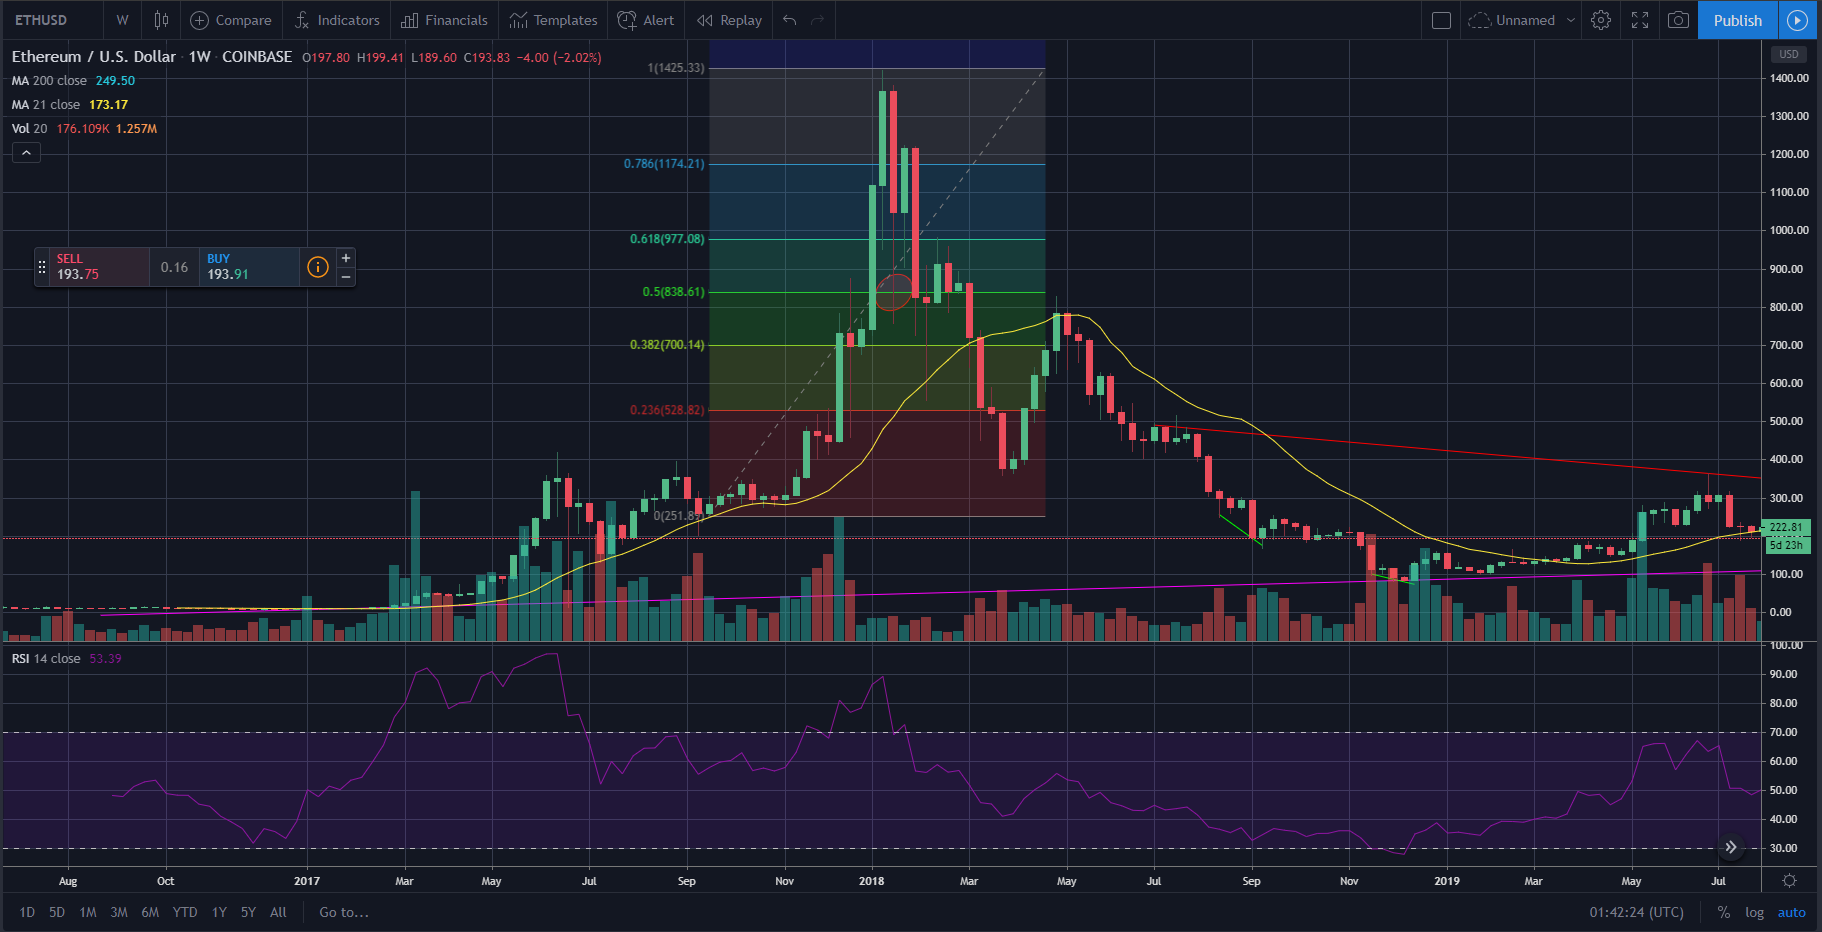</center> --- ### When to buy and hodl? Usually after such a parabolic move up and down following a RSI bearish divergence, the RSI levels will eventually hit the oversold level. This is the point where I suggest to buy and hodl for the longer-term. If you are a more conservative investor, I will even recommend you to zoom out to a longer time frame and wait for RSI to be oversold at that time frame. Taking my HIVE analysis as an example, since my analysis was done on the 4H chart, I will want to see a RSI oversold at the daily chart before I add to my long-term hodlings. I think that what will happen next for HIVE price will be a rebound to maybe the 9300 sats level (yellow arrow in chart below) or the 10000 sats level. After which I think it will eventually find a strong support at the 200 SMA on the 4H chart. It should be around 3500 sats by then and notice how it coincides with the 1.618 fibonacci extension level. <center>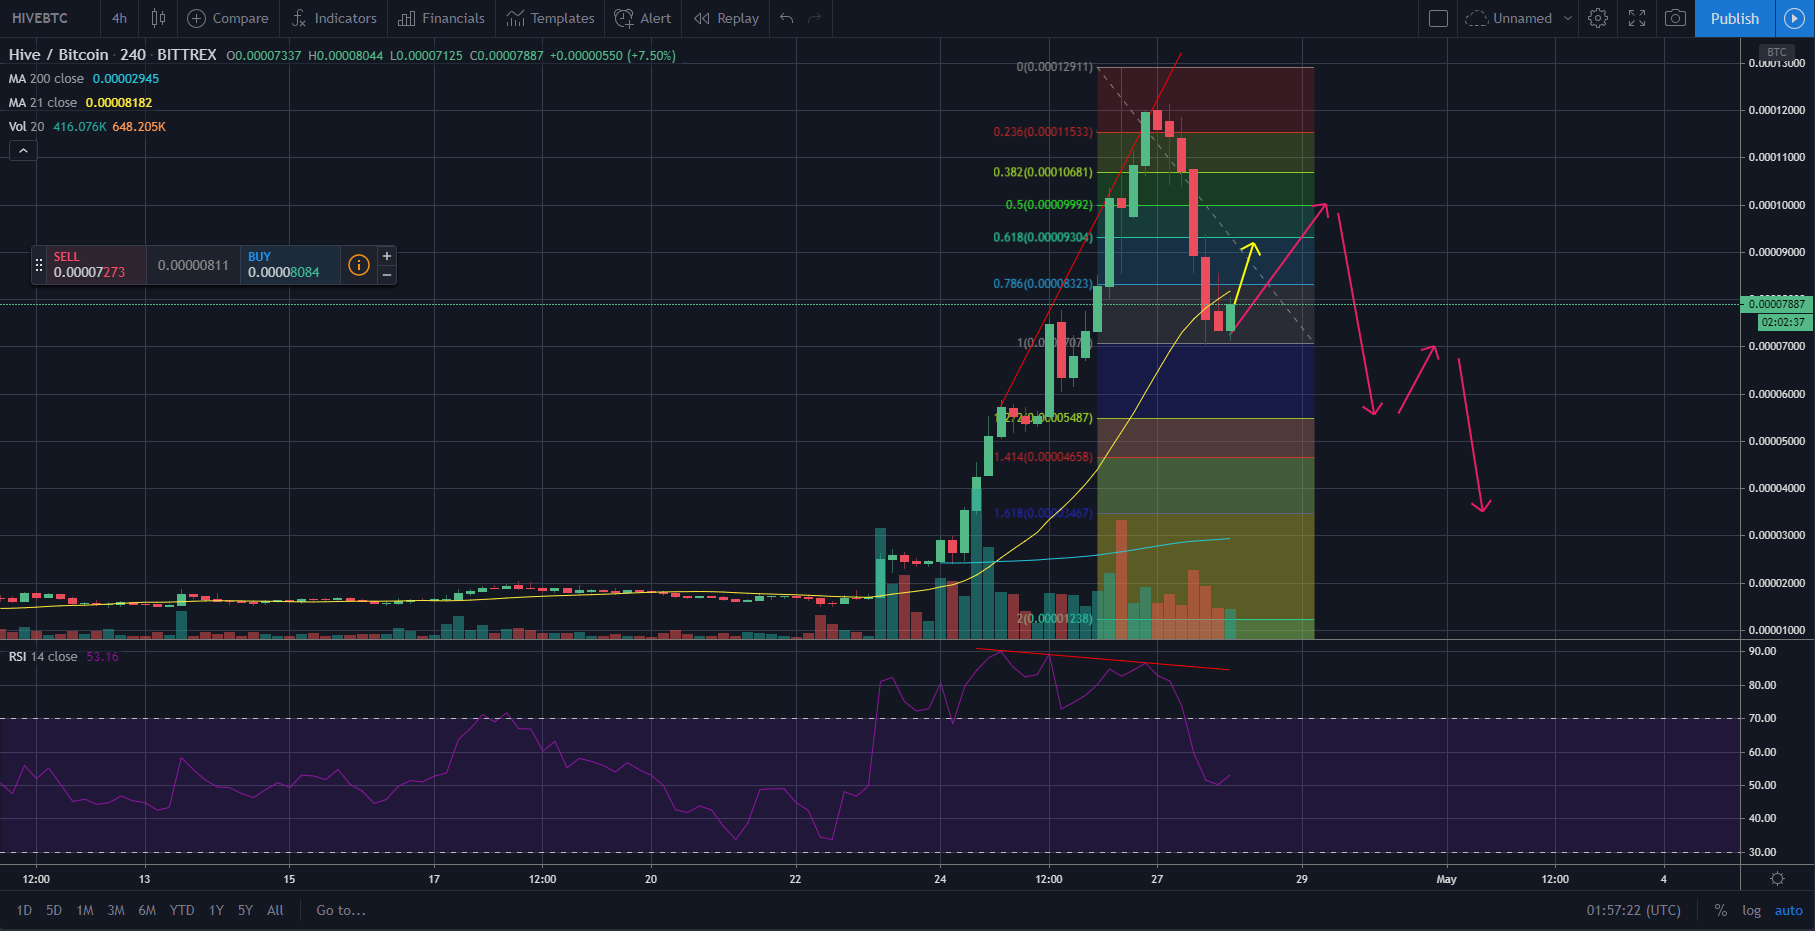</center> **As usual, I am just sharing my thought process and please do not take it as financial advice. Due diligence and research are still required for your own investment.** What do you think will happen to HIVE price next? Leave a comment and let me know 😁 --- <center>***This article is created on the [Hive blockchain](https://hive.io/), an immutable and censorship-resistant content platform. 20% of post rewards goes to @ph-fund, 5% goes to @leo.voter and 5% goes to @peakd to support these amazing projects.***</center> <center></center>
👍 mindtrap-leo, tonimontana.leo, dtrade, khaleelkazi, steemitcentral, arctis, ldelegations, moromaro, a-alice, elleok, dalz1, bearjohn, vxc.leo, leotrail, annabellenoelle, rehan-leo, rollandthomas, gerber, deathwing, emrebeyler, nealmcspadden, steemcityrewards, dappcoder, huaren.news, goodreader, staryao, aivote, someguy123, miti, shitsignals, gallerani, freddio.sport, asteroids, leo.syndication, daan, roleerob, pataty69, cadawg, bestboom, freddio, dlike, triptolemus, determine, steem.leo, mapxv, one.life, maxuvd, accelerator, jlordc, jlordz, gerbo, themarkymark, buildawhale, upmyvote, ipromote, erectus, ripperone, steembasicincome, sbi2, jrvacation, maxgolden, sbi-tokens, fun2learn, nailyourhome, fengchao, nobyeni, ralph-rennoldson, elvielins, crazycatuncle, mrshev, teamsingapore, anthemius, steem-oracle, taco.cat, payroll, wizardzap, darrylnyk, mintymile, hope-on-fire, quotes-haven, rachelcreative, abduljalill, apshamilton, yaelg, hamismsf, jpbliberty, shadonchandra, diyinvestor, unbiasedwriter, hanggggbeeee, acidyo, kevinwong, rahul.stan, cheema1, mister-meeseeks, steeminator3000, fearlessgu, tombstone, mrwang, arconite, awah, schubes, nortjenn, theheralds, apofis, ippua, afiqsejuk, steemvpn, lebah, project.hope, xpilar, gbenga, guruvaj, paragism, cyemela, minerthreat, bigpower, erica005, reflektor, bippe, hingsten, lrcconsult, minimoke, brage, teach-me, cyrusemerson, dses, felixgarciap, cyberspacegod, fusion.lover, tomlee, jagged, auleo, sinlg, jocieprosza, pogarda, dustsweeper, deathcross, hobo.media,