Is Uniswap Going To Flip The Top Centralized Exchanges? | Data On TVL, Volume, Users And Top Pairs
hive-167922·@dalz·
0.000 HBDIs Uniswap Going To Flip The Top Centralized Exchanges? | Data On TVL, Volume, Users And Top Pairs
From all the defi apps we have seen in the previous bull market, Uniswap has kept its dominance and continued to develop and grow. It was the first defi app to bring in users thanks to its simplicity and incentives. Following the FTX collapse and the multiple other collapses centralized entities in 2022, its importance grew even more. Let’s take a look how is the protocol performing under the current market conditions.  Here we will be looking at: - Total value locked - Trading Volume - Uniswap V2 VS V3 in trading volume - Number of users - Top Pairs - Price **The period that we will be looking at is 2022 - 2023.** ## Total Value Locked Here is the chart for the TVL on Uniswap starting from September 2020. 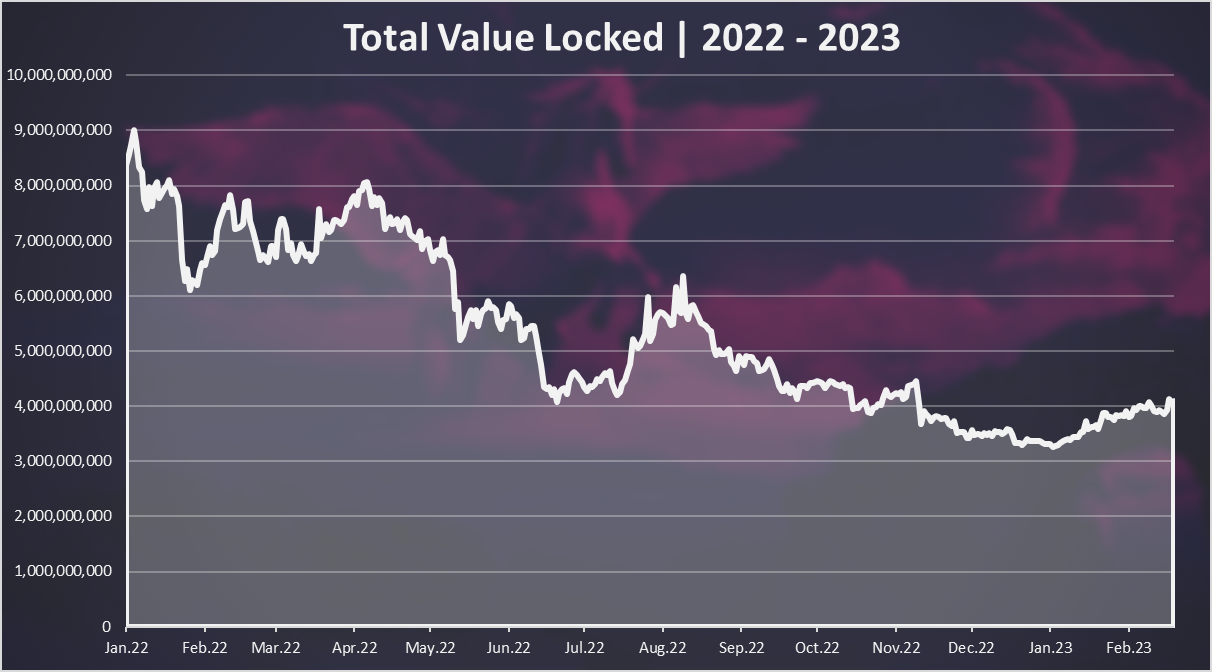 The overall trend in the last year has been down. 2022 started with 9B in TVL and ended with around 3.5B. Even with the relative low amount in the capital pooled in Uniswap at the end of 2022, it is still quite a considerable amount. This year started with a slight growth and the TVL exceed 4B in the first two months of 2023. This is mostly because of the increase in the price in the pooled assets. ## Trading Volume Trading volume is extremely important. That is where the fees come from and the APR for liquidity providers. No trading volume means no fees and no capital in the protocol. The chart for the trading volume looks like this. 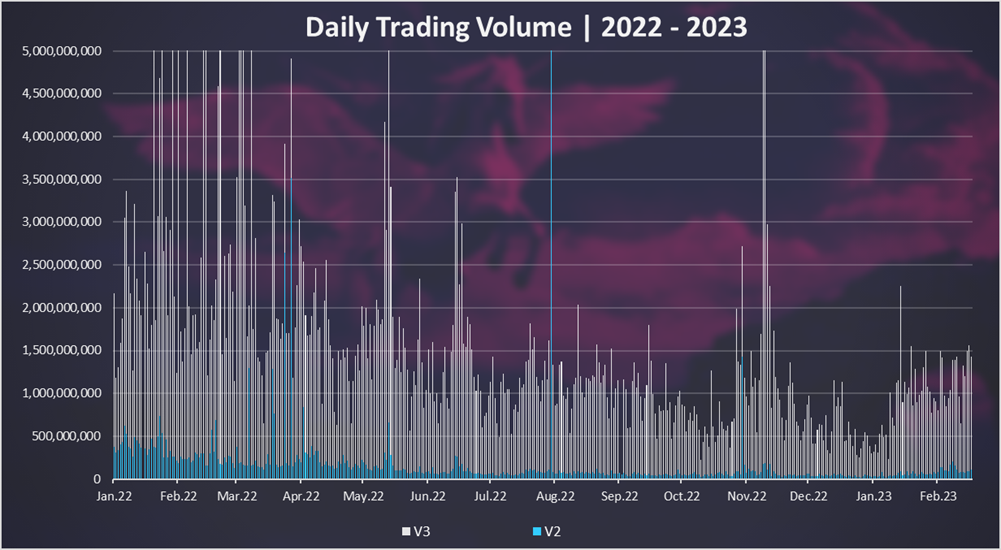 We can see that most of the volume is now from Uniswap V3. The V2 version has dropped behind. V3 was launched back in May 2021, and we can see that it has become dominant. The daily trading volume has also been going down in 2022, with some occasional spikes when a volatile market event happens. We can see that at the begging of 2022 on occasions there was more than 5B in daily trading volume, while going through the end of the year this volume dropped in the range of 0.5B to 1B per day. In 2023 the trading volume started increasing again, reaching 1.5B per day. ### The monthly trading volume looks like this:  Here as well we can notice the drop in the trading volume in 2022. In the first three months of 2022, there was around 90B trading volume on a monthly level, then it dropped to 50B, and in December 2022 this number was 17B. We can notice the spike on monthly level that happened in November 2022, because of the FTX collapse and all the market volatility. In the first month of 2023, the trading volume is up almost to 30B per month. When it comes to the share of the trading volume on V3 vs V2, more than 90% of the trading is now on V3. ## DEX VS CEX Volume If we take a look at the data for the trading volume on the other exchanges provided by some of the aggregators like coingecko the numbers looks like this. An example for the last 24 hours: 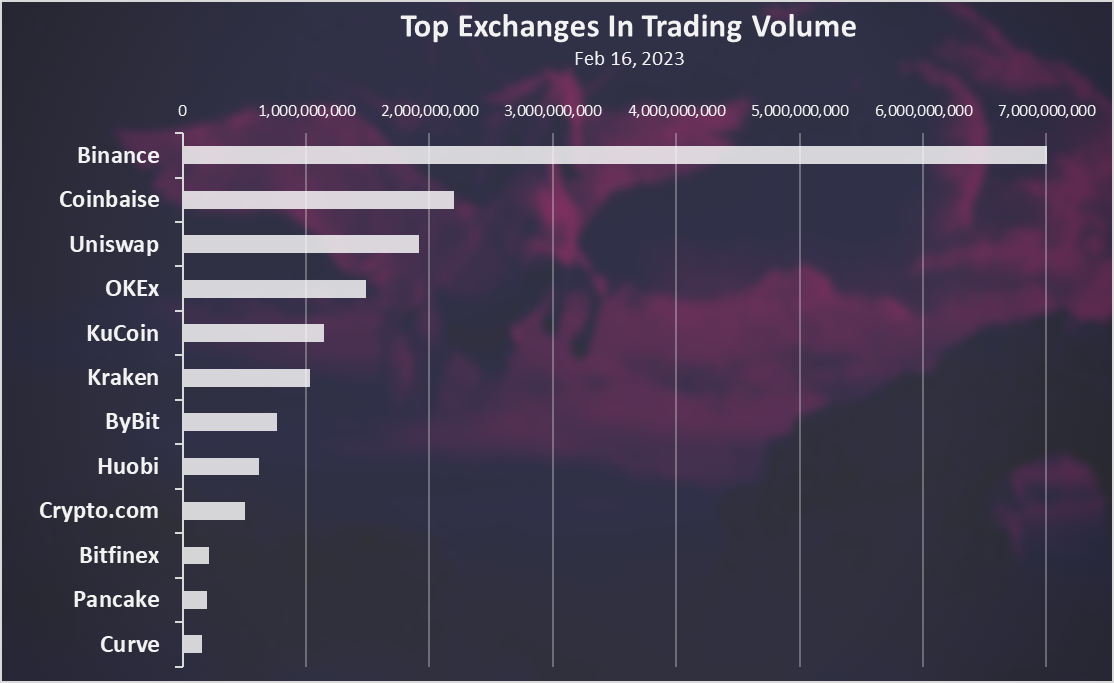 Uniswap ranks on the **3th spot**, just behind the two big boys Binance and Coinbase. It is quite close to Coinbase now, and in the last months it has surpassed it on a few occasions. Binance is still far ahead, but with all the regulator scrutiny it has facing in the period, there will be no surprise if it loses of the market share. Obviously DEXs are now serious competitors to CEXs, with Uniswap leading the way. Who knows maybe one day it will be the number one exchange in the world. There is two more DEXs that are in the top exchanges, Curve and Pancake. ## Active Users How many users Uniswap has? Here is the chart. 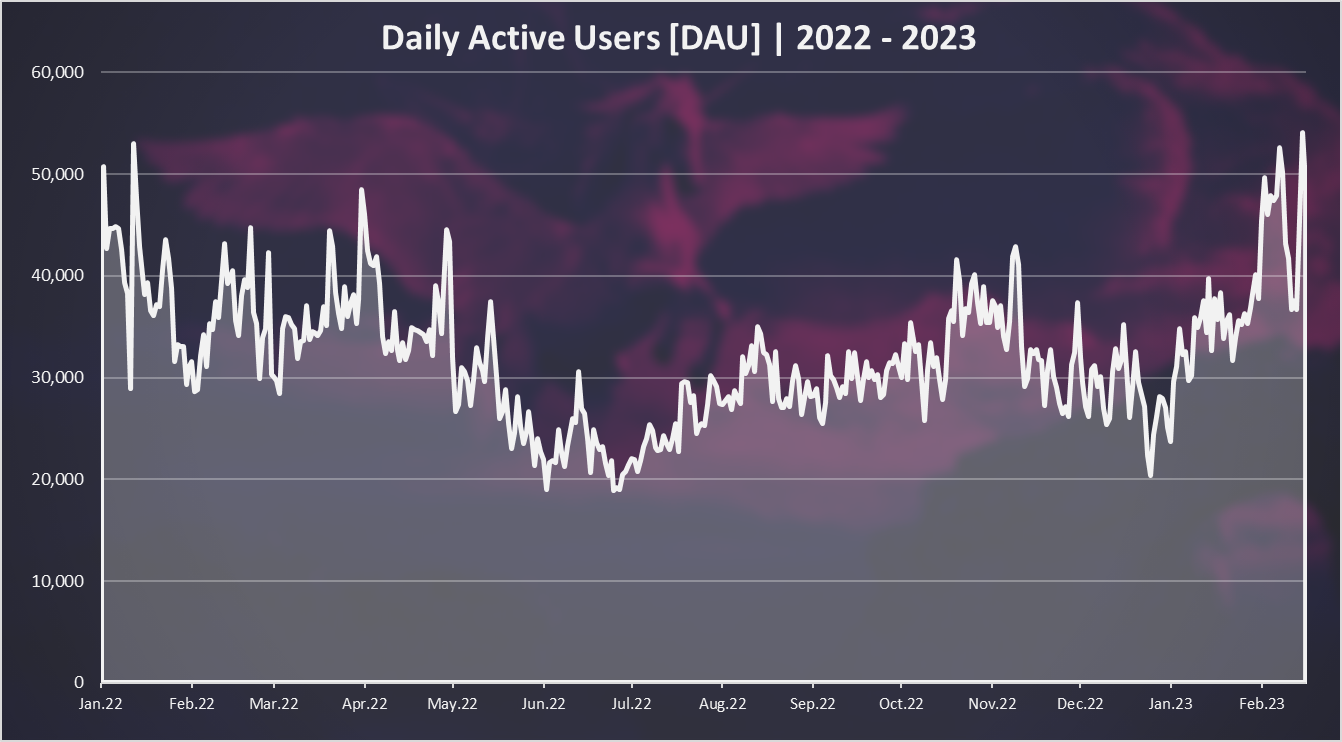 In terms of active users, we can see a reverse trend in the last few months, and now we have almost the same amount of DAUs as the previous year. The number of daily active wallets reached **50k** just recently. It has spiked from a previous lows of around 30k. ### On a monthly basis the chart looks like this: 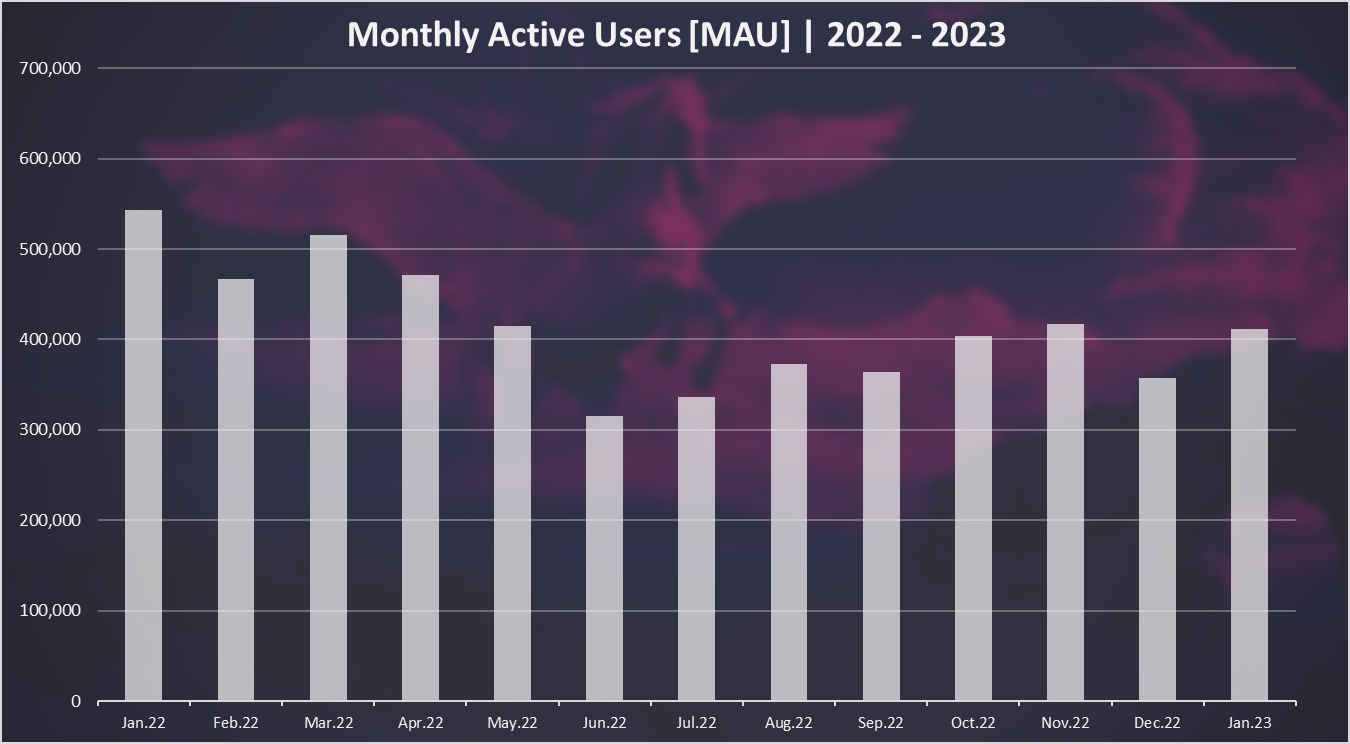 Some take the MAUs as more relevant number, as not all the users are making daily transactions. We can see that the number of MAUS has been in the range of 300k to 500k and it is significantly higher than the DAUs, on a order of magnitude of x10. There is no big spike in the last month as for the DAUs, but maybe this will translate in February that is not over yet. A **400k** in January 2023. Back in January 2022 this number was above 500k. Its lower but not significantly lower. ## Top Trading Pairs on Uniswap Here is the chart for the top trading pairs **ranked by liquidity.** 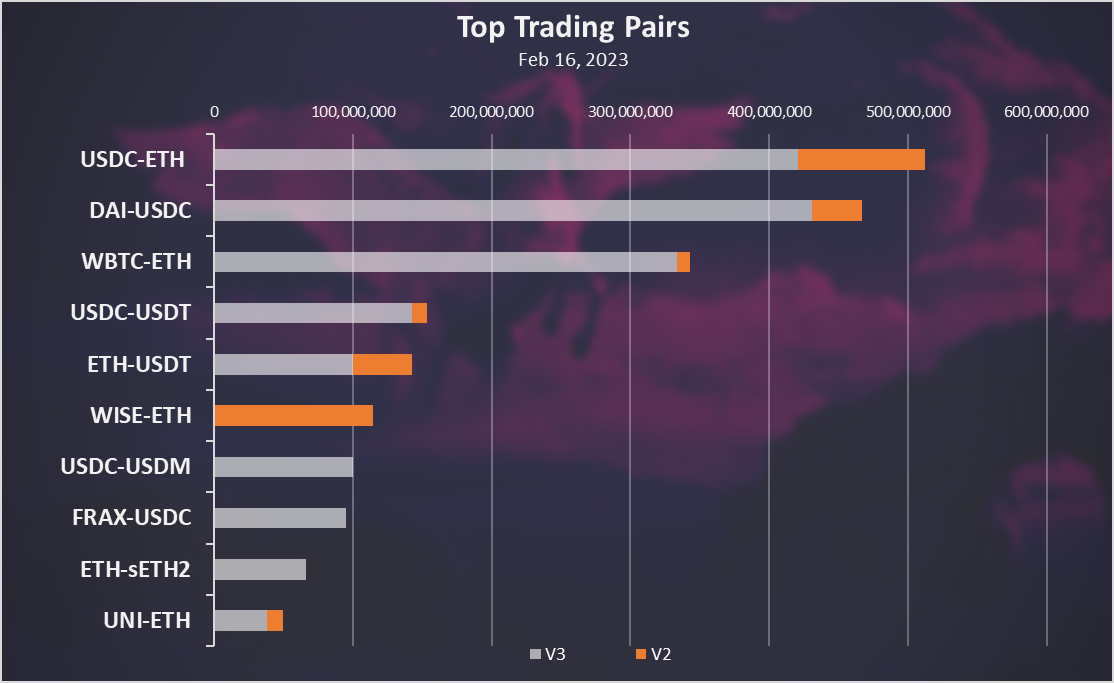 The USDC-ETH pair is on the top with more than 500M combined liquidity. What interesting is that the DAI-USDC pair that is now on the second spot with 470M in liquidity, just a few months ago was dominant on the top with almost 1B in liquidity. Meaning this pair has lost a lot of liquidity, mainly because of the contraction of the USDC and DAI supply. On the third sport is the BTC-ETH pair. A few others stablecoins pairs in the top as well. ## Price The chart for the UNI price looks like this. 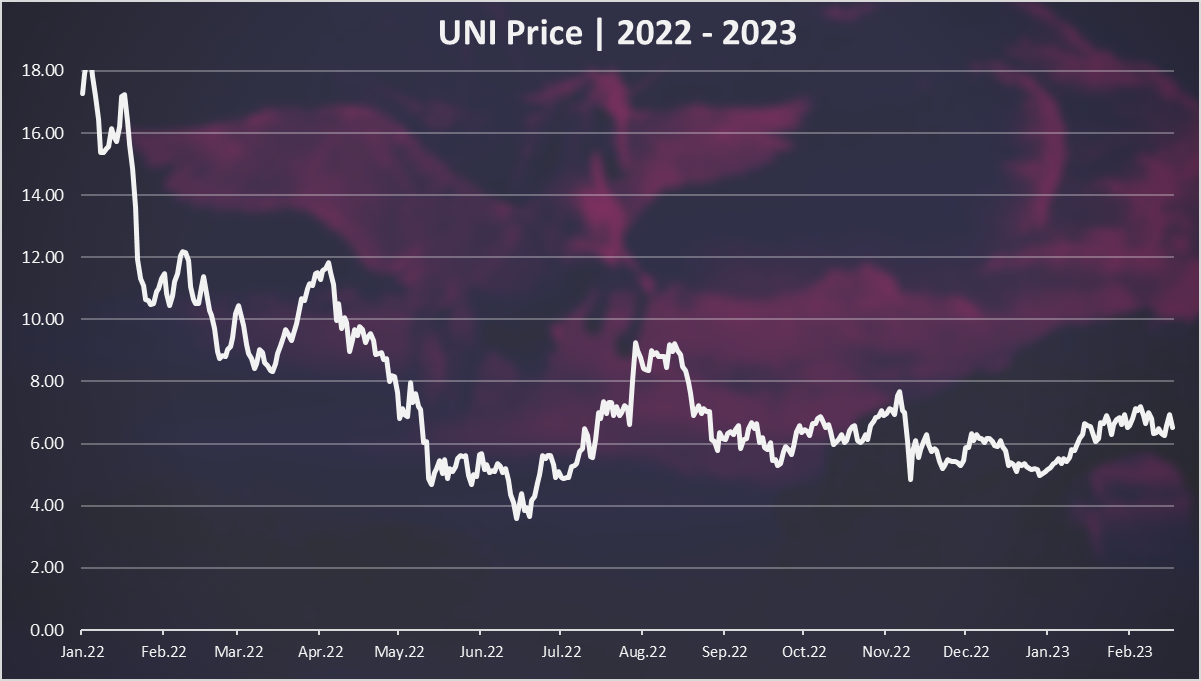 2022 started with Uniswap at 18$ and the token price has been in major decline since then. The low was hit in June 2022, with a 4$ price. A run up to 9$ and a drop again in the range of 5$ to 6$ - We are now closet to 7$ and UNI ranked in the top 20 coins with a 5B market cap. Just a reminder that back in 2021 the ATH for the UNI token was at 40$. ----- The Uniswap protocol keeps on grinding and it has positioned itself as the number one player in the defi world, competing with the top CEXs. It is ranked as number three in terms of trading volume, occasionally climbing to the second spot. The key metrics are showing growth with the TVL, trading volume and number of users all on the rise. In terms of DAUs the numbers are now the same as a year ago. As for the question in the title, Uniswap has already flippened all the exchanges except for Binance. There is still a lot of room for that one, but wont be a surprise if that happens. All the best @dalz Posted Using [LeoFinance <sup>Beta</sup>](https://leofinance.io/@dalz/is-uniswap-going-to-flip-the-top-centralized-exchanges-or-data-on-tvl-volume-users-and-top-pairs)
👍 leovoter, r0nd0n, invest.country, meta.condeas, topbooster.leo, neal.power, dalz1, nikoleondas.leo, dalz.shorts, finguru, nextgen622, netaterra, joeyarnoldvn, tronsformer, bearjohn, vxn666, venarisyndicate, fatman, moeenali, teamvn, smartvote, zuun.net, ffcrossculture, nervi, revise.leo, therealyme, unpopular, sumatranate.leo, drricksanchez, drexlord, harkar, officialhisha, huaren.news, freebornsociety, dashroom, cst90, leomaniacsgr, adiiba, dyrt88, not-a-bird, knowhow92, meesterleo, doze, ryosai, scaredycatguide, scaredycatcurate, swelker101, leoschein, gualteramarelo, bananass, megaleoschein, dugsix, bhealy, generatornation, darinapogodina, maurofolco, solominer.leo, maakue, doobetterhive, therabbitzone, phul, tornad, gerber, ezzy, exyle, steem.leo, mice-k, dcityrewards, deathwing, shitsignals, felander, unconditionalove, bestboom, themightyvolcano, nateaguila, dlike, followjohngalt, cakemonster, triplea.bot, ribary, dcrops, pjansen.leo, pjansen.ctp, daan, alphacore, emrebeyler, hykss.leo, ausbit.dev, kaniz, poliwalt10, dinvest, merlin7, dpoll.witness, dine77, rabona, sahil07, dumnebari, not-a-gamer, revisesociology, yogacoach, edb, ninnu, revise.spk, shebe, marianaemilia, erikahfit, bala41288, carl05, dosh, carlosro, hkinuvaime, scrubs24, splintercell-01, reppilc, elfino28, bteim, eijibr, genepoolchlrn8r, genepoolrentsclr, sanjeev021, brucolac, lordb, dub-c, vrezion, genepoolcardlord, kanibot, kamaleshwar, chandra.shekar, kannannv, dudeontheweb, jagmeet12, dragonmk47, sunshineee, w4d, kendewitt, gerardoguacaran, kgakakillerg, pet.society, sharpshot, crookshanks, city-of-dresden, giemo, culgin, asmr.tist, garlet, kgsupport, victor-alexander, diabonua, vietthuy, improbableliason, resiliencia.pal, shanghaipreneur, steembasicincome, howiemac, jongolson, tigerrkg, banvie, cocaaladioxine, anikys3reasure, buildingpies, sbi-tokens, qwertm, voter, ericburgoyne, cbridges573, sneakyninja, thedailysneak, ravensavage, dfacademy, balaz, znnuksfe, abdulmath, libertyleo27, coyotelation, fullcoverbetting, russellstockley, netaterra.leo, libertyctp27, hive.friends, piensocrates, libertygame27, heyitshaas, steem-tube, kreur, hiro-hive, rezoanulv.leo, josequintana, simplifylife, goldmonsters, noborders, leeyh2, nikoszzz, ctpsb, eturnerx, naty16, jeanlucsr, paragism, thisisawesome, ph1102.ctp, elianaicgomes, imfarhad, lacrucita, aslehansen, myupvote2u, luckyali.ctp, abh12345.ctp, zwhammer, johnripper, mypathtofire, sabajfa, gamer00, bloghound, awesomecuration, iproto, naniplayergamer, meanbees, hive-data, flaxz, achim03.ctp, gallatin, cryptoccshow, pladozero, xabi, abcor, abacam, cards4rent, oadissin, bet1x2, svirus, curatorcat.leo, skiptvads, leomolina, bilpcoinbpc, galenkp, hive-168869, penguinpablo, cryptonized, tomiscurious, we-are-lucky, hungrybear, funnyman, jacuzzi, goldbuyer, ctp.sub, saboin.ctp, gloriaolar, ahmetay, gokturk70, bilgin70, flsfserkan, privex, kph, celestegray, hivehustlers, thatsweeneyguy, mytechtrail, piotrgrafik, jglake, maddogmike, successchar, thepeakstudio, holoferncro, hankanon, kam5iz, zealous4ever, acidyo, ghaazi, rendrianarma, leveluplifestyle, trasto, gniksivart, mister-meeseeks, juanvegetarian, soyrosa, bluerobo, abh12345.leo, crazydaisy, hivelist, kind.network, groove-logic, ganjafrmer, tehox, meltysquid, hebrew, gollumkp, luciannagy, pearlsuddy, deadswitch, kryptik.tigrrr3d, krunkypuram, mrbonkers, v4vapid, muratkbesiroglu, abh12345, steemadi, jayna, abitcoinskeptic, philnewton, misterengagement, mattbrown.art, isabel-vihu, hk-curation, tryskele, taskmaster4450, unyimeetuk, racibo, bilpcoin.pay, hive-108278, rohansuares, rpren, susie-saver, onealfa, l337m45732, the.rocket.panda, crypt0holics, pocketrocket, daltono, elderson, flowerbaby, the13anarchist, meowcurator, cassillas5553, jmsansan.leo, vikbuddy, uruiamme, technicalside, hjrrodriguez, kriszrokk, shanibeer, tomhall.leo, sweetest, pvinny69, olympicdragon, trostparadox, diverse, xyba, himanisoni, spectrumecons, vegoutt-travel, captainhive, photographercr, young-kedar, eforucom.leo, fw206, steem-key, discernente, borislavzlatanov, jk6276, stdd, we-are, anna-newkey, djbravo, edicted, iansart, anonsteve, ykroys, limka, bitcoinflood, edkarnie, lrekt01, listnerds, director.rar, nnaraoh, steemitboard, marivic10, fengchao, hivebuzz, cwow2, arcange, shainemata, vxc.leo, politicalhive, ass.hole, newsflash, ammonite.leo, hive.samadi, resonator, ura-soul, informationwar, leprechaun, ausbitbank, tftproject, truthforce, risemultiversity, dmwh, empress-eremmy, haccolong, deepdives, inigo-montoya-jr, shanhenry, delver, investinfreedom, riskneutral, kennyskitchen, stevescoins, dbroze, hoaithu, anhvu, frankydoodle, commonlaw, clownworld, jimbobbill, maxsieg, awuahbenjamin, urun, vimukthi, master-lamps.ctp, pboulet, konvik, leoplaw, trustexchange, schindmaehre,